
Port Monitoring of Application Servers with JBoss Tools
You may have noticed over the years, that your server view’s context menu has an option labeled "Port Monitoring". You may have also noticed that when using JBoss servers, nothing was ever available there. Recent commits have finally remedied this decade-long omission of a useful feature.
TCP/IP Monitor
The WTP platform includes a TCP/IP monitor as a standalone entity. You can use it manually, which I’ll explain now, but the real magic happens when integrated with our server adapters.
There are two primary pieces to the TCP/IP Monitor. First, there’s a preference page, where you can add port mappings and enable or disable monitoring on that port. Secondly, there’s a TCP/IP Monitor view.
The Preference Page
To see the preference page for port monitoring, you’ll want to go to . You’ll see the page depicted below.
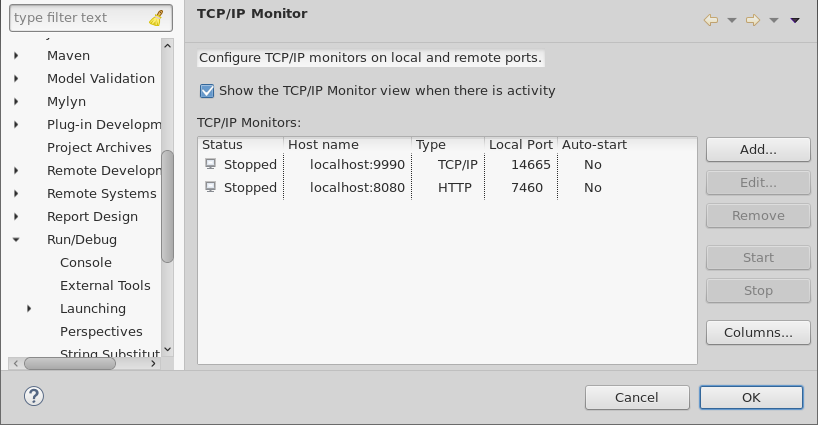
The general concept of the tool is that, in order to monitor a given port (for example localhost:8080), you "Add…" a monitor that listens on some new port (7460) and redirects all traffic to the target destination (localhost:8080). Once this is enabled, only requests to your "Local Port", in this case 7460, can be monitored. Traffic that goes directly to 8080 is bypassing the monitor entirely.
If you click "Add…", you’ll see a few fields to fill out. The "Local Monitoring Port" is the new port that will position itself between origin and destination. Below that, the "Host name" and "Port" represent your actual intended destination. Traffic can be either declared as HTTP or TCP/IP in nature, and you can set a timeout.
Once you’ve added a monitor, you can click on it in the preference page and select "Start", to activate the monitoring on that port.
The View
Once monitoring of traffic has been enabled, you can go ahead and open the view. Window → Show View → Other → TCP/IP Monitor. If you had a wildfly started (either externally or using the server adapters), you could go to http://localhost:7460/ in the browser. The TCP/IP monitoring will be updated with requests and traffic information as shown below.
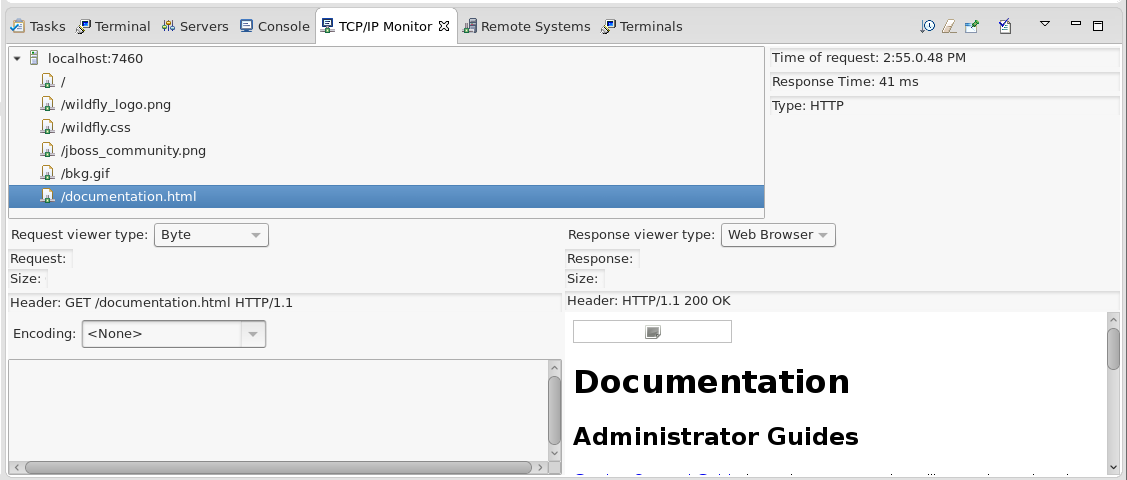
Clicking on each individual request will show you both the request on the left side, and the response on the right. It will preview images that were requested, or simply display the contents of any text requests and responses. Headers are also shown for both the request and the response.
Integration with the Servers View
While everything seems to work nicely in the above simple example, tools need to make sure that they make requests to the new Local Port rather than the actual destination. Our recent commits focussed on this deficiency.
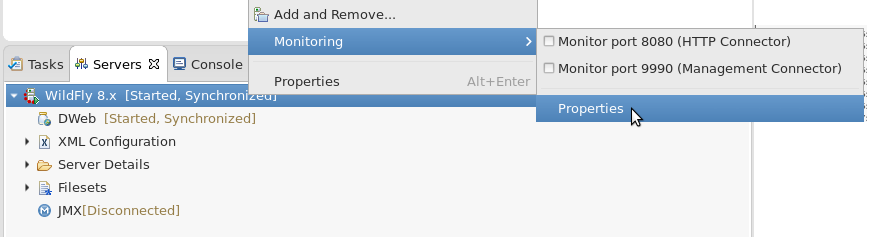
To see this in action with the Servers View, you’ll want to open your Servers View. You hopefully already have a WildFly instance installed there, which you can go ahead and start now. When you right-click on your Server Adapter, you’ll see a "Monitoring" menu item. We currently have support for monitoring requests on two ports: the HTTP port (8080, typically) and the management port (9990).
After that, you can create a web project with a servlet or a simple html file and deploy it to the server. If you then right-click on your resource and select Run As → Run On Server, you should see the browser open up to the URL http://localhost:7460/YourProject/index.html (or similar URL). In this way, the tools have made sure to make all requests to the Local Port when port monitoring is enabled, but to make all requests to the actual destination port when monitoring is disabled.
When your server is in a management-enabled profile, requests made to the WildFly Management port will also show up in the TCP/IP monitor for inspection.
Conclusion
So there we have it: A long-standing omission has finally been put in place. What’s more, other server adapters don’t integrate with this feature as completely as we do. If you were to run the same experiment on the Tomcat adapter, and execute the "Run As → Run on Server" action for a web project’s servlet or html file, the browser will still open up on port 8080, rather than the Local Port which can be used for monitoring. When targeting JBoss and WildFly servers, though, these actions behave as a user would expect and hope.
So get in there and monitor some traffic! Grab a nightly build from our downloads section, or just use our nightly update site directly:
http://download.jboss.org/jbosstools/updates/nightly/mars/
Rob Stryker
