OpenShift Tools enables you to debug your deployed OpenShift applications within the IDE, enabling you to take advantage of the IDE debugging tools. This article specifically details the steps needed to set up an OpenShift Online Java application for debugging. A number of configuration tasks are required both locally and remotely to enable the IDE debugger to connect to the OpenShift server and OpenShift Tools for achieving this. Some tasks only need to be completed once for each OpenShift Online application but others must be completed every time you reconnect to OpenShift Online from the IDE.
Instructions are provided for the following tasks:
This article guides you through each of these configuration requirements and must be completed in the given order.
| Your application must be deployed on OpenShift before attempting to configure the OpenShift application for debugging and enabling port forwarding. |
1. Configure the OpenShift Application for Debugging
You must first configure your OpenShift application for debugging, which requires setting the Enable JPDA (Java Platform Debugger Architecture) marker in your application source code and republishing the application. Marker information is retained with the application so you only need to complete this task once for each OpenShift Online application:
To configure the OpenShift application for debugging, complete the following steps:
-
In the
Project Explorerview, right-click{project name}and click . -
In the
Configure OpenShift Markerswindow, select theEnable JPDAcheck box and clickOK.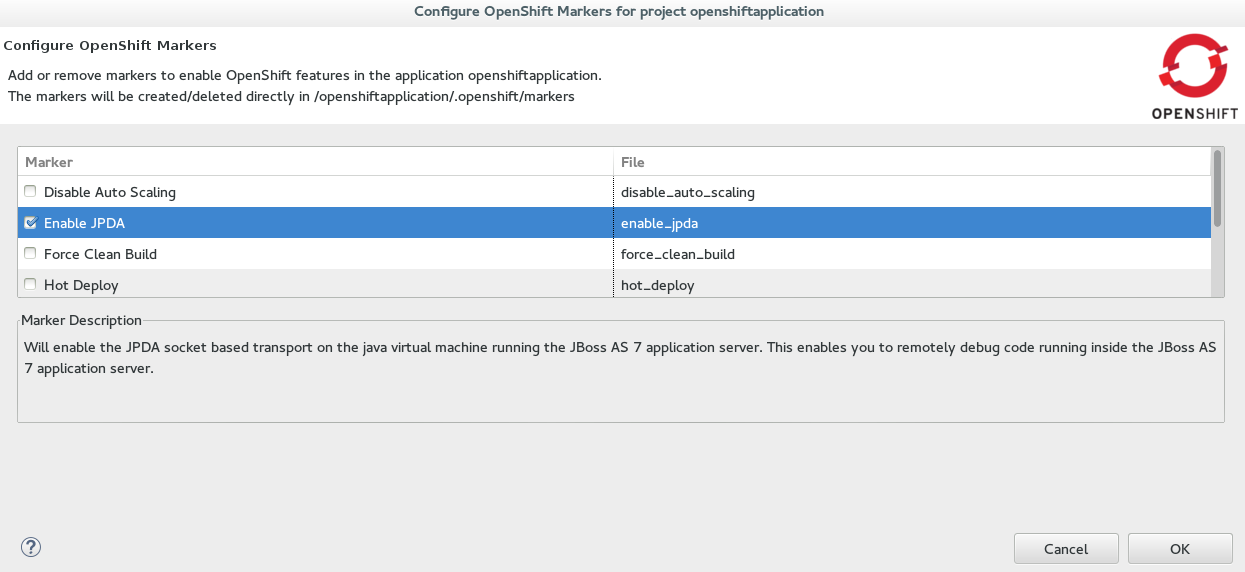 Figure 1. OpenShift Enable JPDA Marker Selected
 -
In the
Serversview, right-click{application name} at OpenShiftand clickPublish. -
In the
Publish Changeswindow, in theCommit messagefield type a message for the commit. -
From the
Fileslist, ensure the.openshift/markers/enable_jpdacheck box is selected and clickCommit and Publish.
The project changes are pushed to the remote Git repository and the application is automatically updated on the OpenShift server.
When debugging is enabled on the OpenShift application a debug port is assigned; for default Java applications the debug port is 8787. To perform the remaining tasks, it is important to know which port is the debug port. To identify the debug port for other applications, see the cartridge documentation.
|
2. Enable Port Forwarding for the Local and Remote Debug Ports
After the OpenShift application is configured for debugging, you must enable port forwarding for the local (IDE) and remote (OpenShift server) debug ports. You can achieve this with the OpenShift Tools Application port forwarding wizard, which connects all local ports to their remote counterpart ports, including the local and remote debug ports.
Port forwarding is automatically stopped when your OpenShift Online connection closes; this includes closing the IDE or changing workspaces. You must enable port forwarding every time you reconnect to OpenShift Online from the IDE.
To enable port forwarding, complete the following steps:
-
In the
OpenShift Explorerview, right-click{application name}and clickPort Forwarding. -
In the
Application port forwardingwindow, clickStart All. Ensure theStatusvalue showsStartedfor the debug ports and clickOKto close theApplication port forwardingwindow.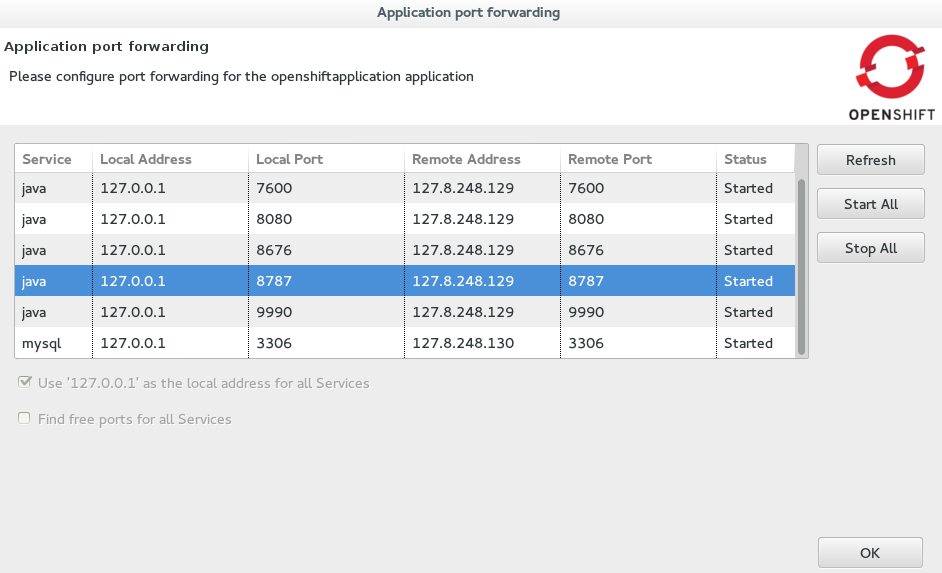 Figure 2. Port Forwarding Started for All Ports
3. Configure and Connect the IDE Debugger
With port forwarding configured for the debug ports, you must create a debug configuration for the OpenShift server and connect the IDE debugger. You can then review debug output in the Debug and Console views. The debug configuration is retained with the workspace so you only need to create a new debug configuration once for each OpenShift Online application. But you must restart each debug configuration every time you reconnect to OpenShift Online from the IDE.
To configure and connect the IDE Debugger, complete the following steps:
-
In the global toolbar of the JBoss perspective, click the drop-down list for the
Debugicon and selectDebug Configurations. -
From the debug configurations list, select
Remote Java Applicationand click theNew launch configurationicon
-
In the
Connecttab, complete the following fields:-
In the
Projectfield, type the name of the workspace project associated with the OpenShift application or clickBrowseto locate the project. -
In the
Portfield, type the value of the debug port. -
Click
Applyand then clickDebug.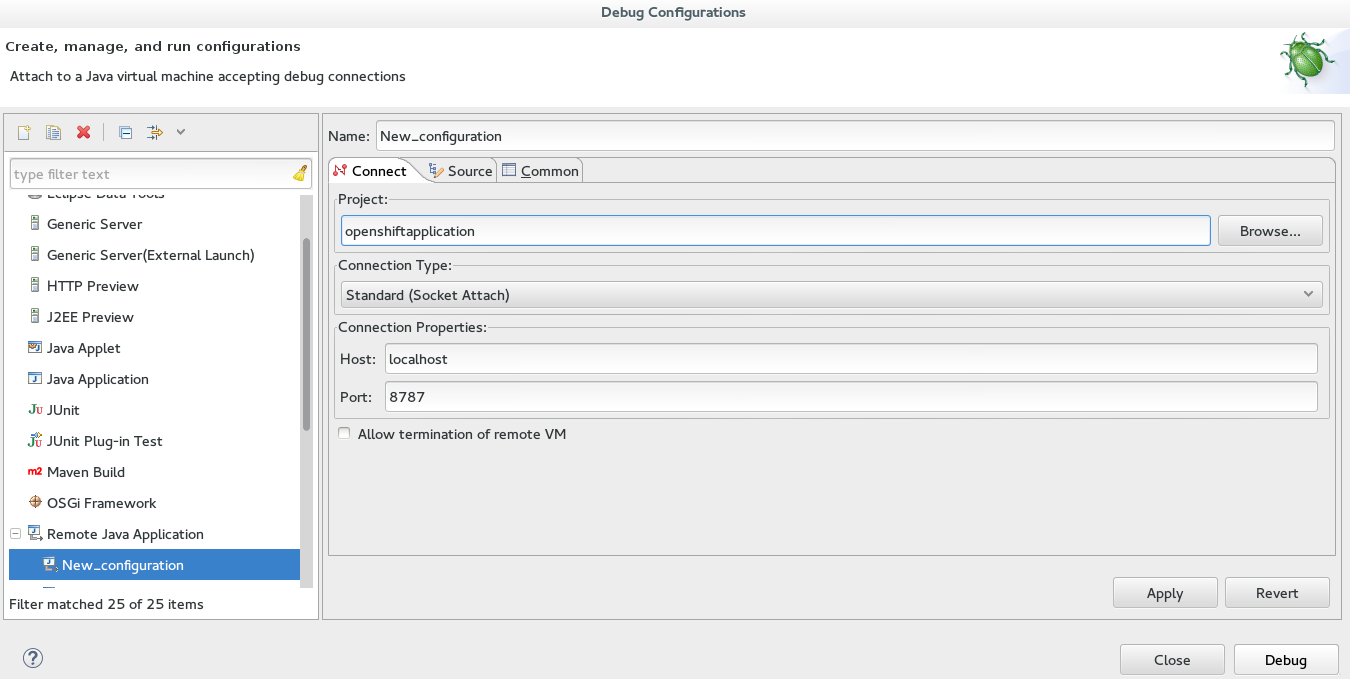 Figure 3. Debug Configuration Ready for Your OpenShift Application
-
Connecting to the OpenShift server may take some time to complete and you can monitor the progress in the Progress bar or Progress view.
Did You Know?
-
Setting the Enable JPDA marker adds an
.openshift/markers/enable_jpdafile to your project. To locate the hidden.openshiftdirectory and access the file, open theNavigatorview. -
You can also access the
Port Forwardingwizard by right-clicking{application name} at OpenShiftin theServersview, and clicking . -
The
Debugperspective automatically arranges useful views for debugging. To open theDebugperspective, click . -
You can set the debugger to look up source code for classes it encounters that are not contained in your project, for example classes used by application servers defined in the IDE. When inputing values for the launch configuration, in the
Sourcetab clickAdd. From the list of source containers, selectJBoss Maven Source Containerand clickOK. The JBoss Maven Source Container uses indexes available from Maven repositories to locate the source code. From the list, select a runtime server, the libraries of which will be indexed in the JBoss Maven Source Container, and clickOK.