JBoss Tools 4.14.0 and Red Hat CodeReady Studio 12.14 for Eclipse 2019-12 are here waiting for you. Check it out!
Installation
Red Hat CodeReady Studio comes with everything pre-bundled in its installer. Simply download it from our Red Hat CodeReady product page and run it like this:
java -jar codereadystudio-<installername>.jar
JBoss Tools or Bring-Your-Own-Eclipse (BYOE) CodeReady Studio require a bit more:
This release requires at least Eclipse 4.14 (2019-12) but we recommend using the latest Eclipse 4.14 2019-12 JEE Bundle since then you get most of the dependencies preinstalled.
Once you have installed Eclipse, you can either find us on the Eclipse Marketplace under "JBoss Tools" or "Red Hat CodeReady Studio".
For JBoss Tools, you can also use our update site directly.
http://download.jboss.org/jbosstools/photon/stable/updates/
What is new?
Our main focus for this release was a new tooling for the Quarkus framework, improvements for container based development and bug fixing. Eclipse 2019-12 itself has a lot of new cool stuff but let me highlight just a few updates in both Eclipse 2019-12 and JBoss Tools plugins that I think are worth mentioning.
OpenShift
OpenShift Container Platform 4.3 support
With the new OpenShift Container Platform (OCP) 4.3 now available (see this article), JBoss Tools is compatible with this major release in a transparent way. Just define your connection to your OCP 4.3 based cluster as you did before for an OCP 3 cluster, and use the tooling !
New OpenShift Application Explorer view
A new OpenShift Application Explorer window has been added in addition to the OpenShift Explorer. It is based on OpenShift Do. It provides a different and simplified user experience allowing easy and rapid feedback through inner loop and debugging.
Let’s see it in action.
Opening the OpenShift Application Explorer view
If you opened a brand new workspace, you should see the OpenShift Application Explorer view in the list of views available on the botton part of the screen:

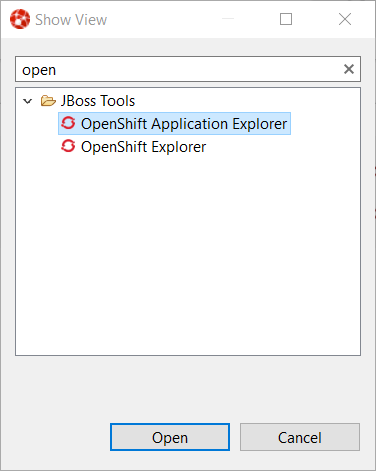
If you don’t see the view being listed, you can open it
through the Window -→ Show View -→ OtheropenOpenShift Application Explorer
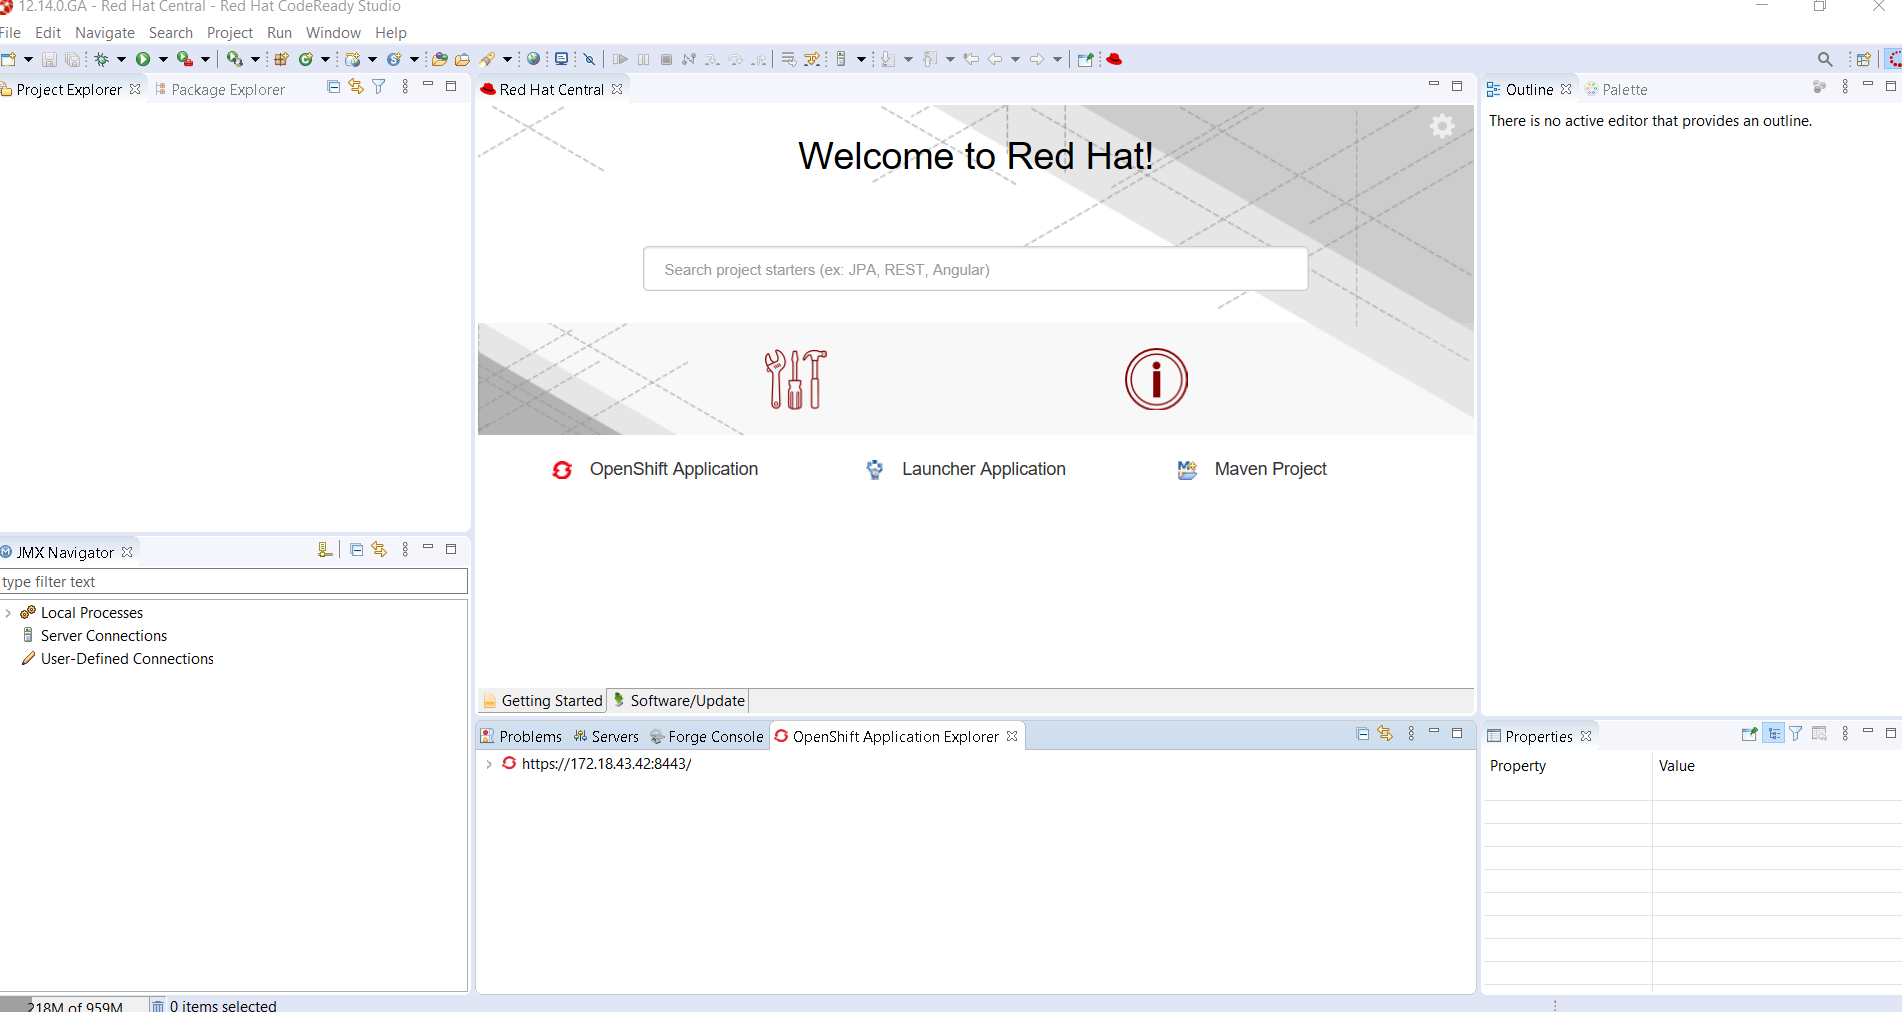
Expanding the root node will display the list of projects available on the cluster:

Java based micro service
We will show how to deploy a Java based microservice and
how to use the various features. But we first need to load
the component source code in our workspace. Thanks to the
launcher wizard, we can do that easilly. Try Ctrl+NLauncher project
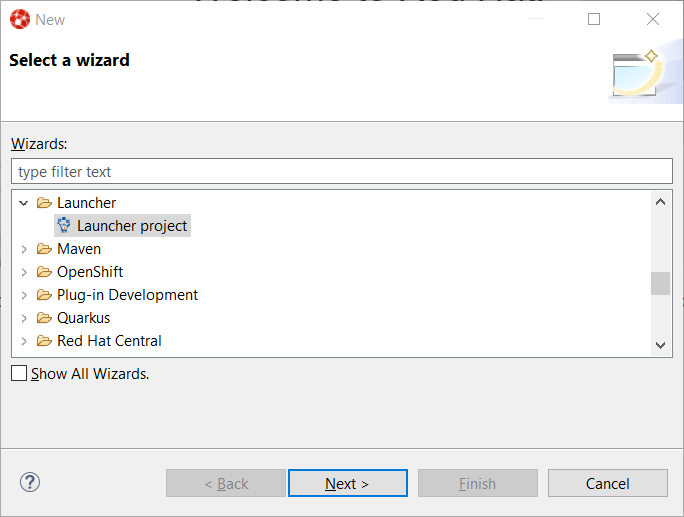
Then click the Next
Select rest-httpMissionvert.x communityRuntimemyserviceProject name
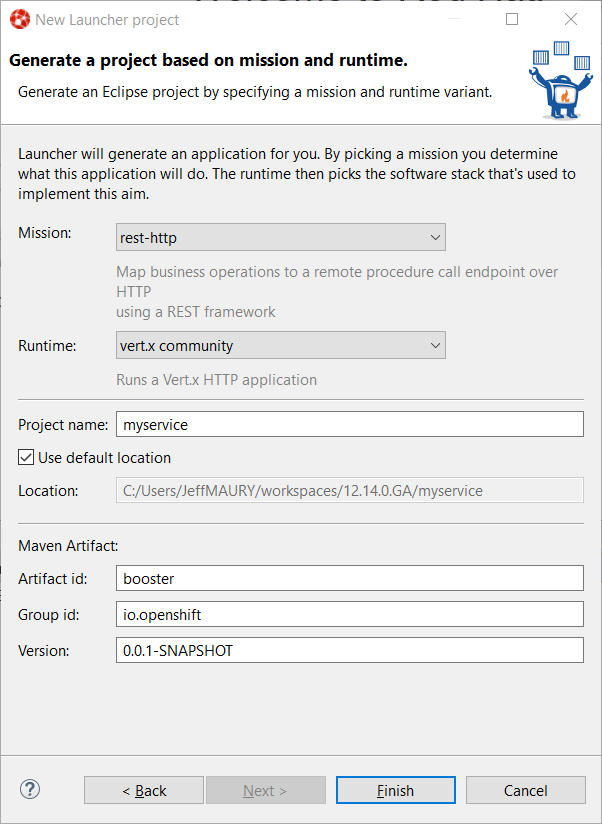
Then click the Finish
Create the component
Now that we have the source code, we can create the component. From the OpenShift Application Explorer view,
right select the project (myproject), and the click the
New → Component
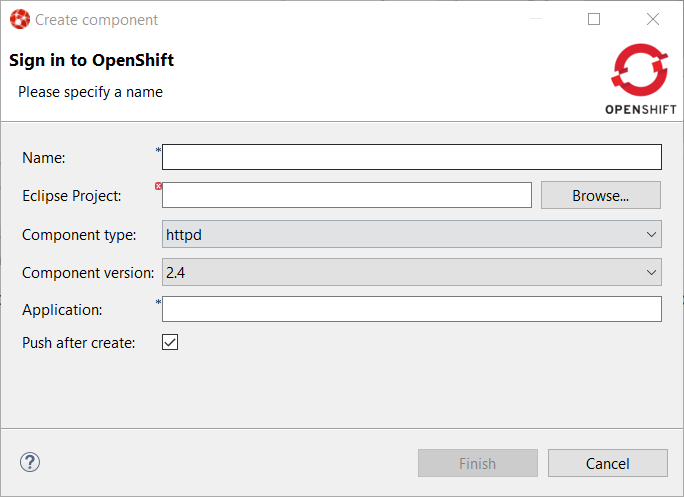
Enter myserviceNameBrowsejavaComponent type8Component versionmyappApplicationPush after create
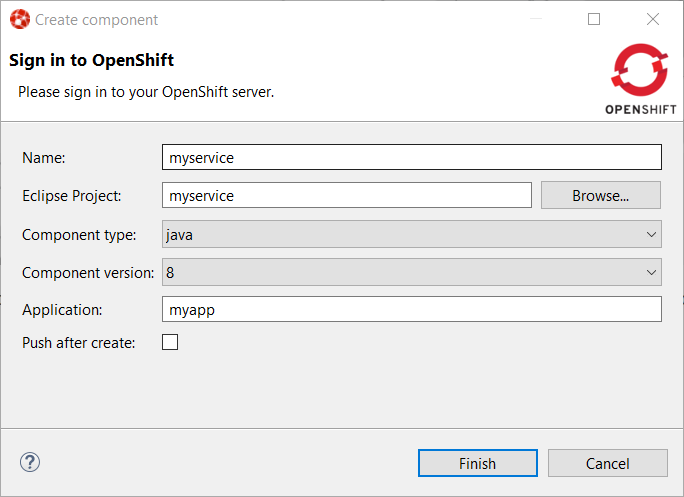
Then click the Finish

Expanding the application will now display our component:

The component has been created but it is not yet deployed on the cluster (as we
unchecked the Push after createPushConsole
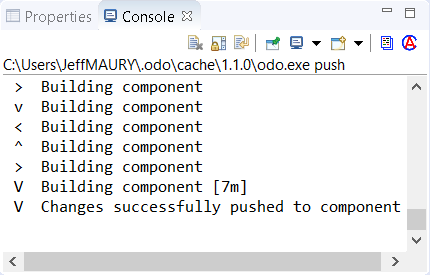
The component is now deployed to the cluster but we cannot access it as we need
to define an URL to access it externally. Right select the component and click
the New → URL
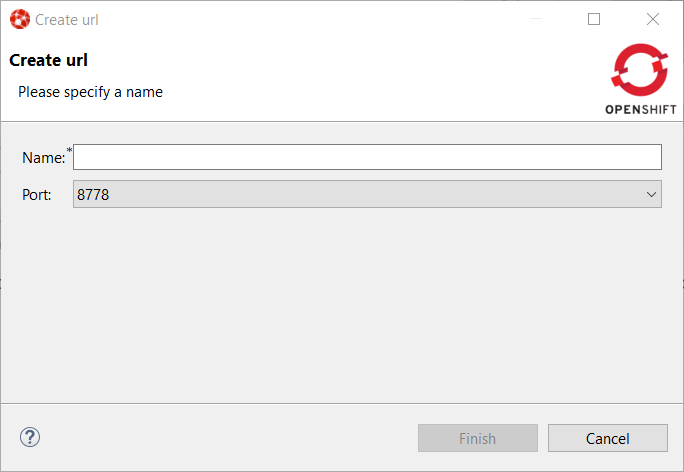
Enter url1Name8080Port
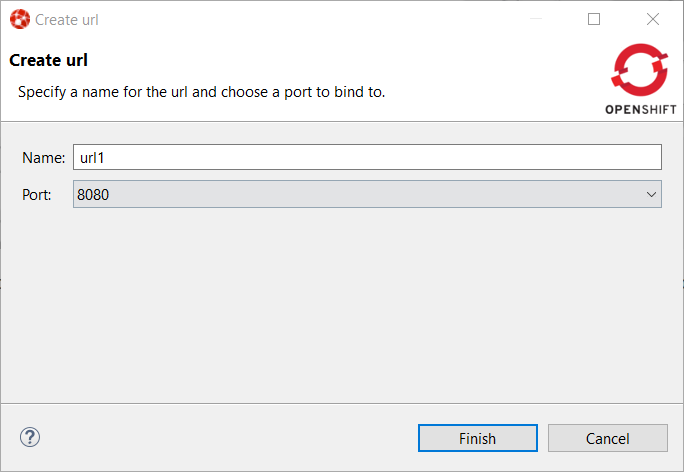
Then click on the FinishConsole
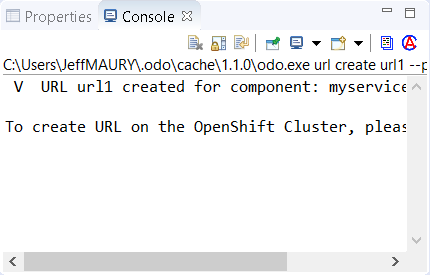
So push the component again (component → Push
Let’s check that we can now access the service. Expand the component level so that we can see the URL we have just created:

Right select the URL and click the Open in Browser
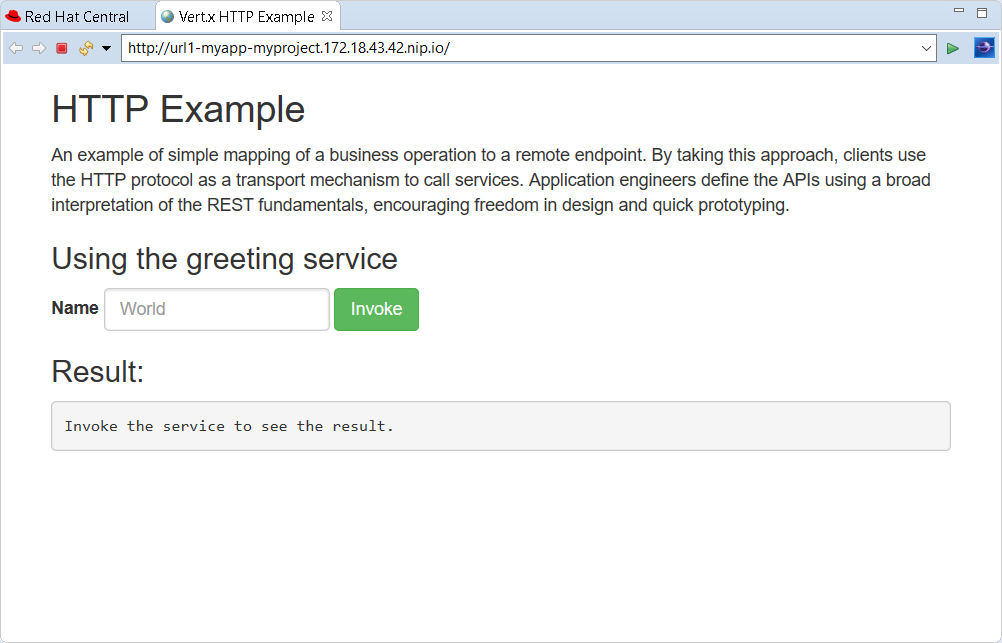
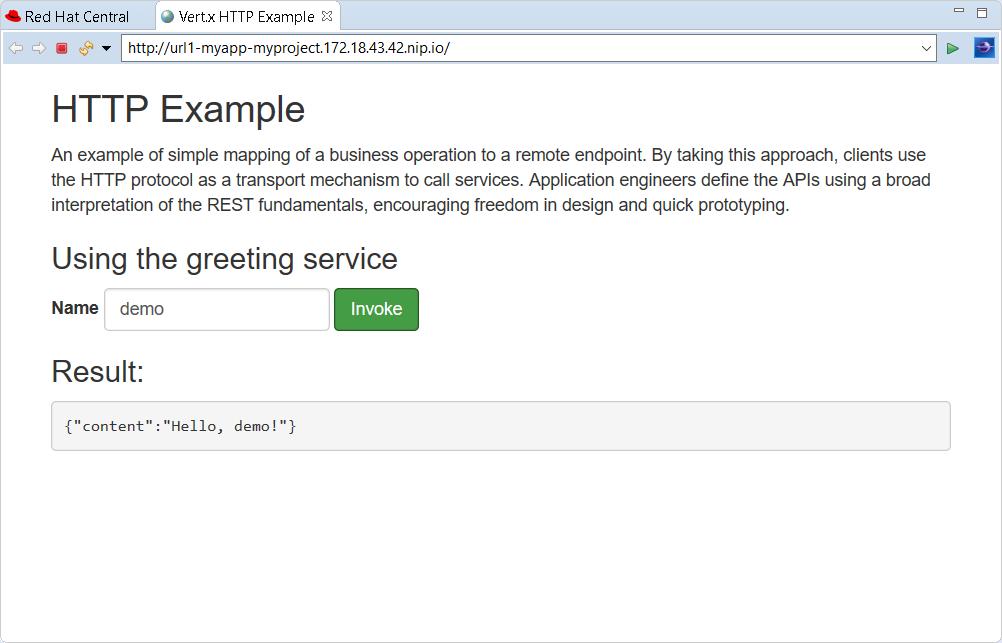
You can test the service: enter demoInvoke
Feedback loop
We will now see how we can get fast feedback on code changes. So let’s modify the application code and see how we can synchronize the changes to the cluster.
In the Project ExplorerHttpApplication.java
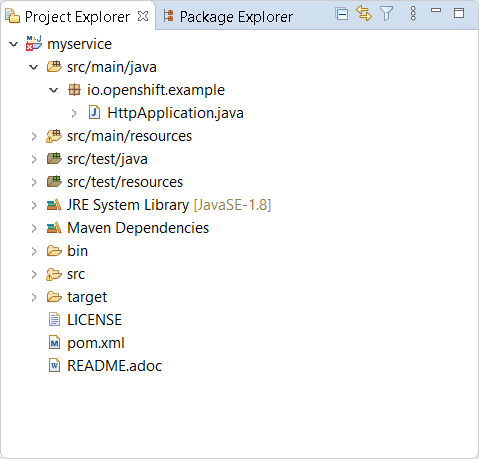
Double click on the file to open the editor:
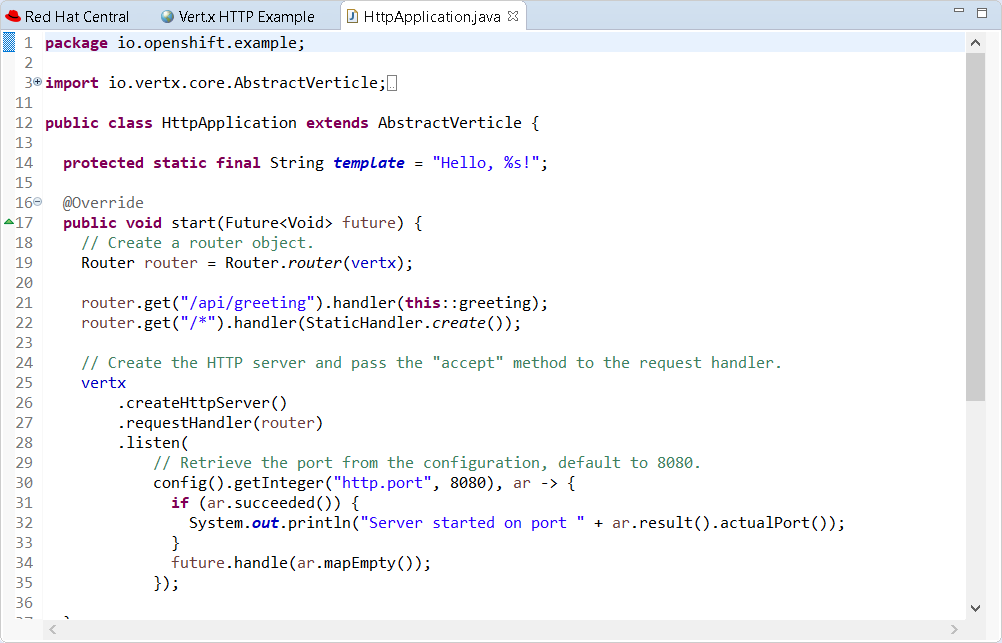
On line 14, change the line:
protected static final String template = "Hello, %s!";to
protected static final String template = "Hello, %s!, we modified the code";and press the Ctrl+S
For the OpenShift Application Explorer, right click the component (myservice) and
click the Push
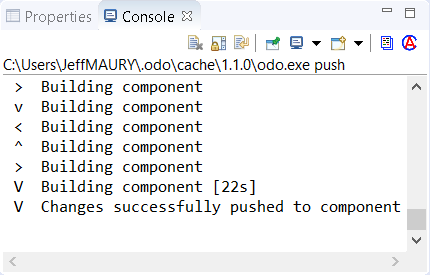
Select the browser window again, enter demo1Invoke
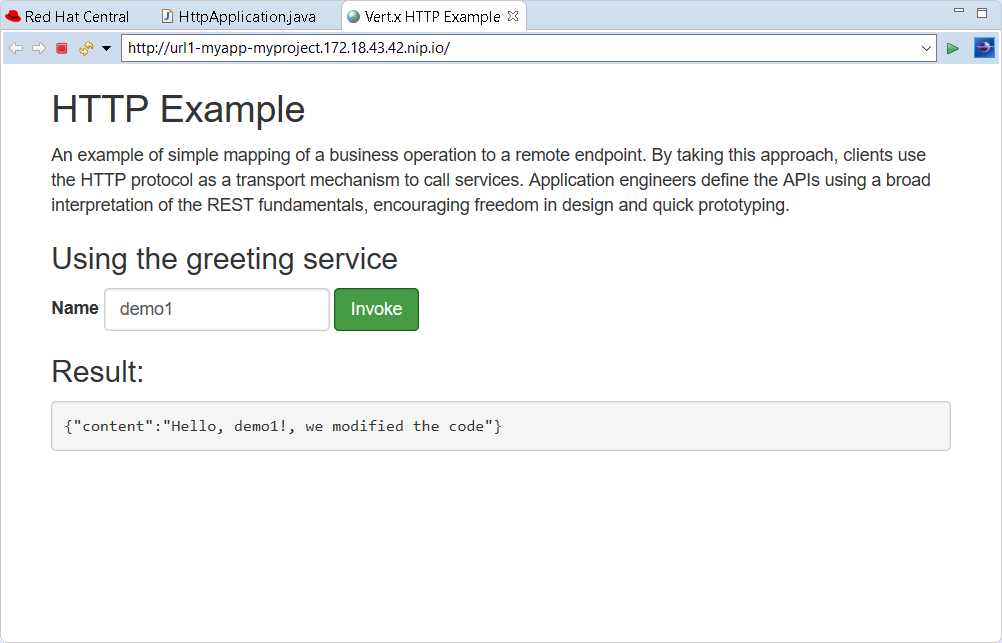
We’ve seen that, through a sequence of code modification(s) followed by a synchronize
action (push) to the cluster, we can get a very fast feedback. If you don’t want to
manually synchronize the the cluster (push), you can opt to automatically synchronize
to the cluster with the Watch
Going further: debug your application on the cluster
Testing an application through code changes is a great achievement so far but it may be difficult for complex applications where we need to understand how the code behaves without the need to use the UI. That’s why the next step is to be able to debug our application live on the cluster.
The new OpenShift Application Explorer allow such a scenario. We will first set up a breakpoint
in our application code. Select again the HttpApplication.javagreeting
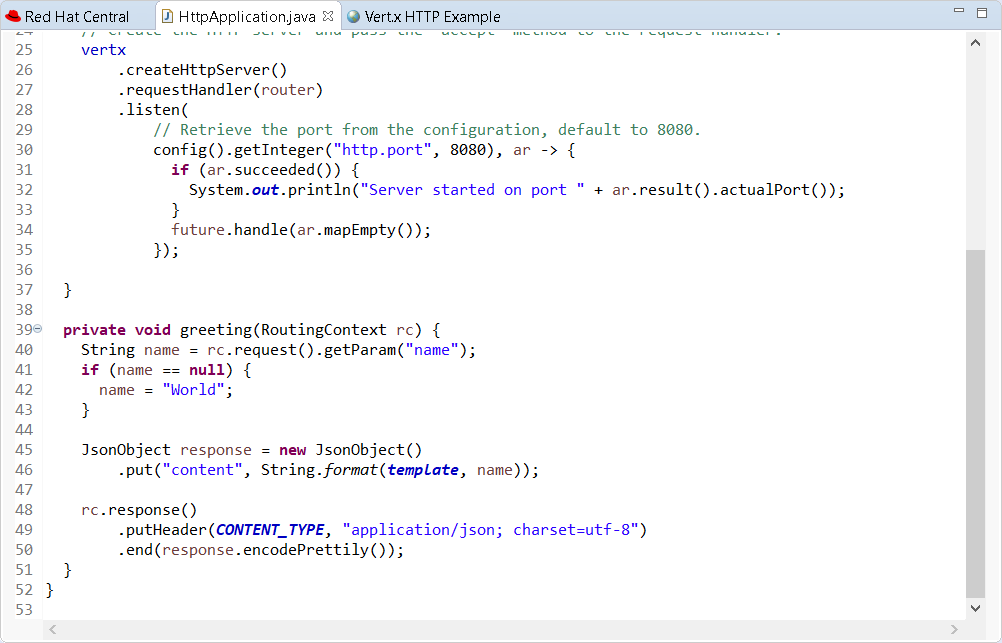
On line 41, double click in the left ruler column so that a breakpoint is set:

We are now ready to debug our application. In order to do that, we need to launch
a local (Java in our case) debugger that will be connected to our application on the
cluster. This is what the DebugDebug
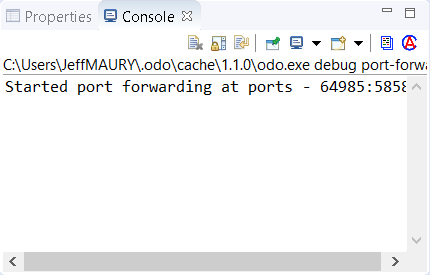
and then a local (Java) debugger is launched and connected to that port. Let’s check now that we can debug our application:
Select the browser window again, enter demo2InvokeDebugRemember my decision
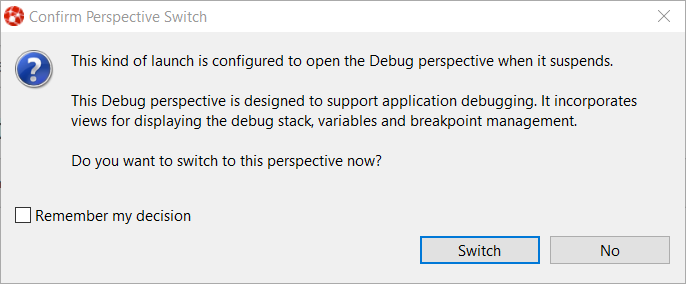
Click the SwitchDebug
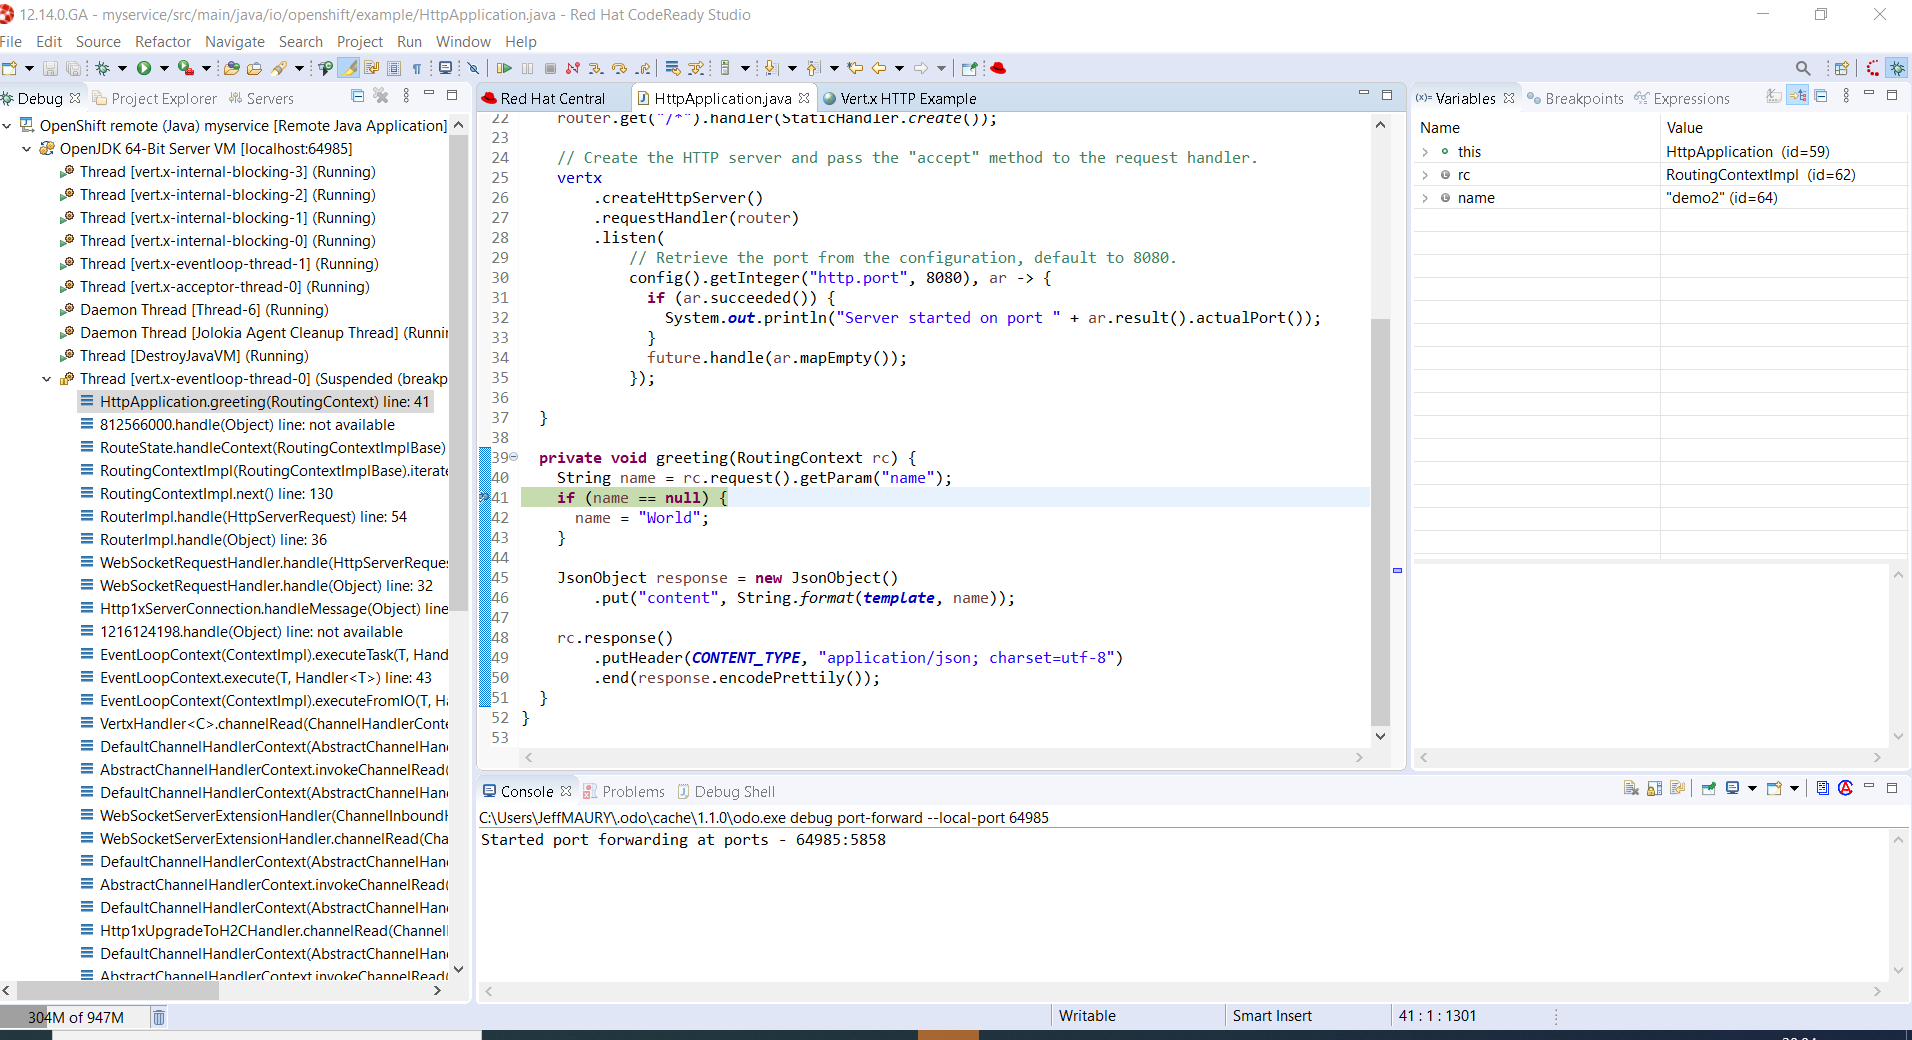
You are now debugging a Java component running on a remote cluster just like it was running locally on your workstation. Please note that we demoed this feature using a Java based component but we also support the same feature to NodeJS based components.
Quarkus
Starting with this release, we’ve added a new Quarkus tooling for applications built on top of the Supersonic Subatomic Java Quarkus framework.
Quarkus project creation wizard
A new wizard has been added to create a new Quarkus application project in your workspace. In order to launch it, first enter Ctrl+N to get the list of available wizards
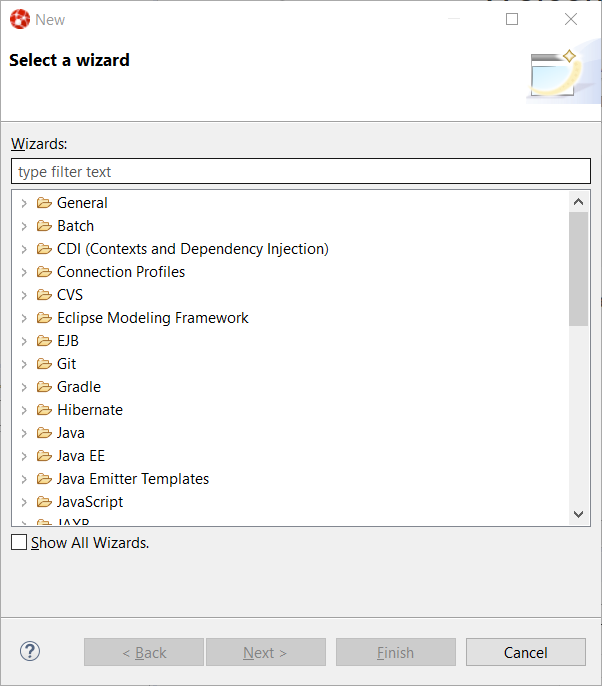
In the filter text box, enter the qu
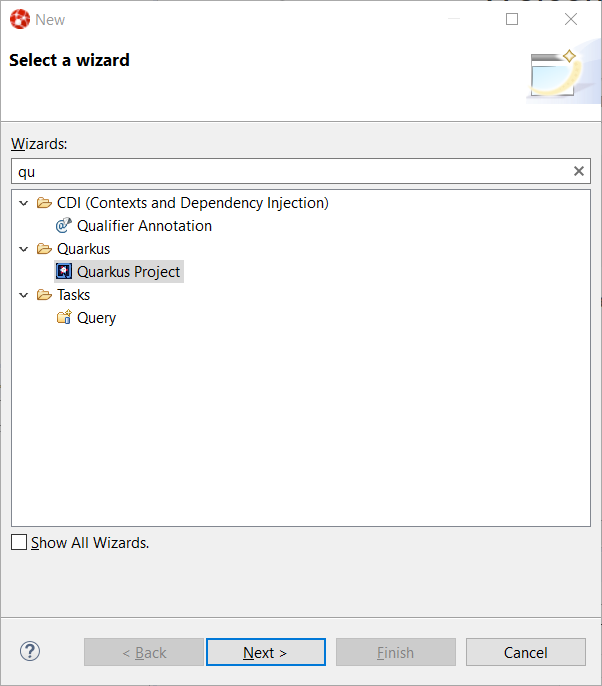
Select the Quarkus Project wizard and click the Next button:
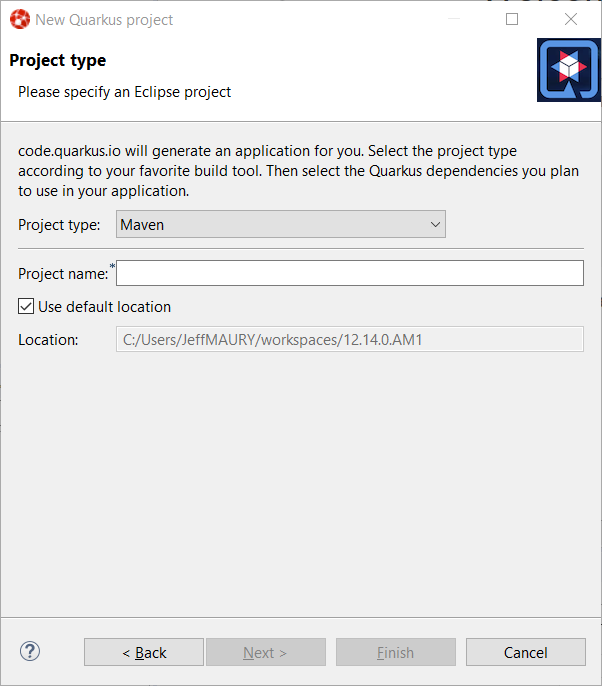
The Project type combo allows you to choose between Maven or Gradle tool used to manage your project. We’ll go with Maven for this tutorial.
Enter a project name (we will use code-with-quarkus) and click the Next button:
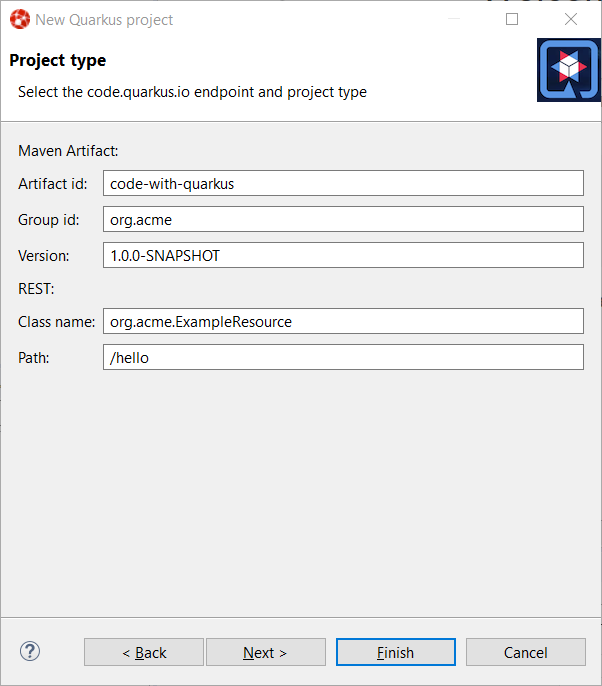
This dialog allows you to choose various parameters for you project, like the project coordinates (group id, artifact id and version) along with the base REST endpoint information. We’ll use the default so click on the Next button:
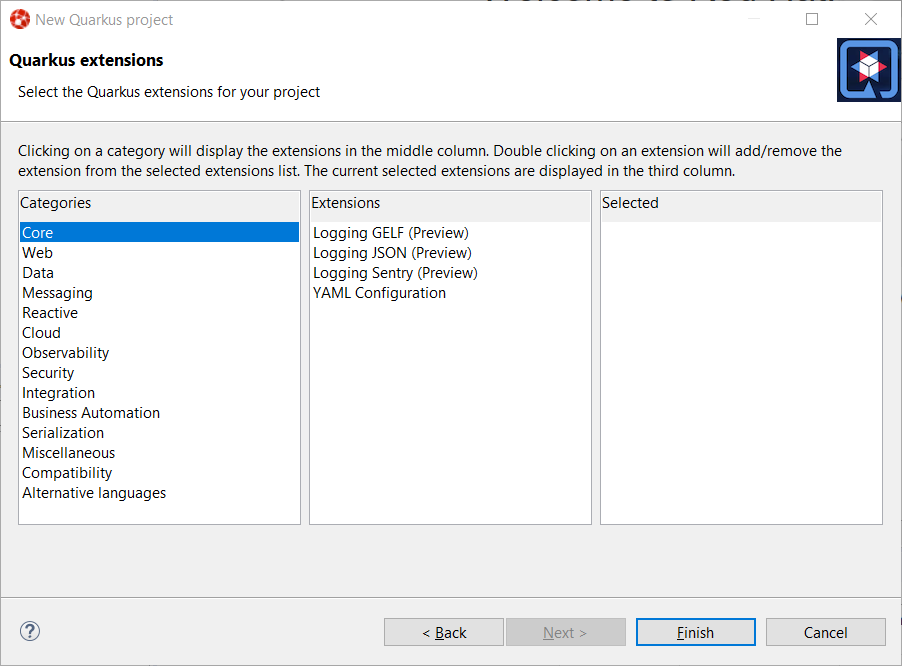
This dialog allows to select which Quarkus extensions you want to add to your project. The extensions are grouped by categories, so first select a specific category in the left table. We will choose the Web one:
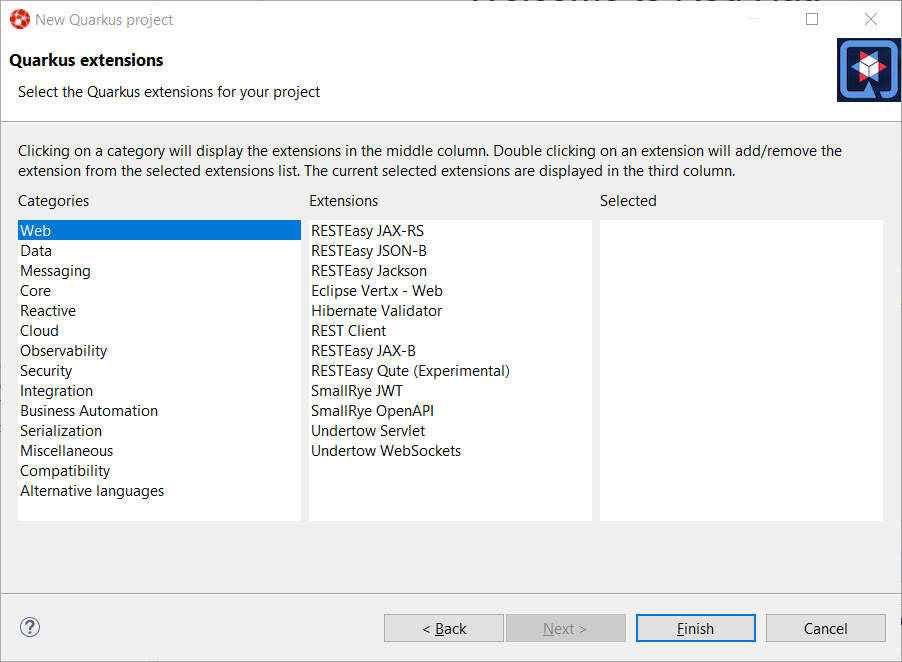
You should have noticed that the middle table has been updated. In order to add an extension, double click on the extension in the middle table. We will add RESTEasy JAX-RS and RESTEasy Qute (a templating engine):
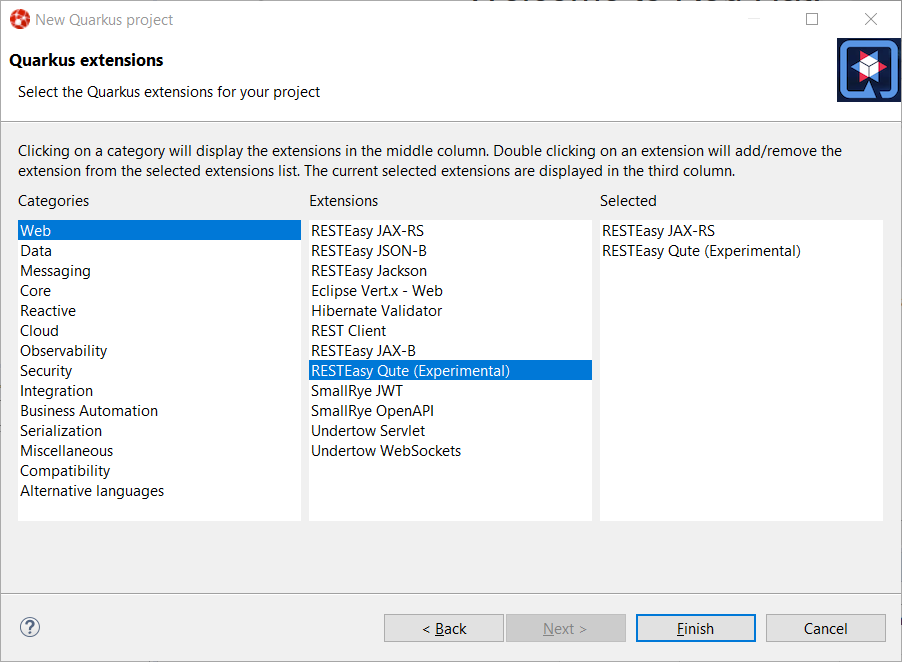
You should have noticed that the extensions that you double clicked on are now being added to the right table. If you want to remove an extension from the list of selected ones, double click again either in the center table or in the right table.
We are now all set so click on the Finish button to launch the project creation. The project creation job is then launched, dependencies are being retrieved and after a while, the new project will appear in the Project Explorer window:
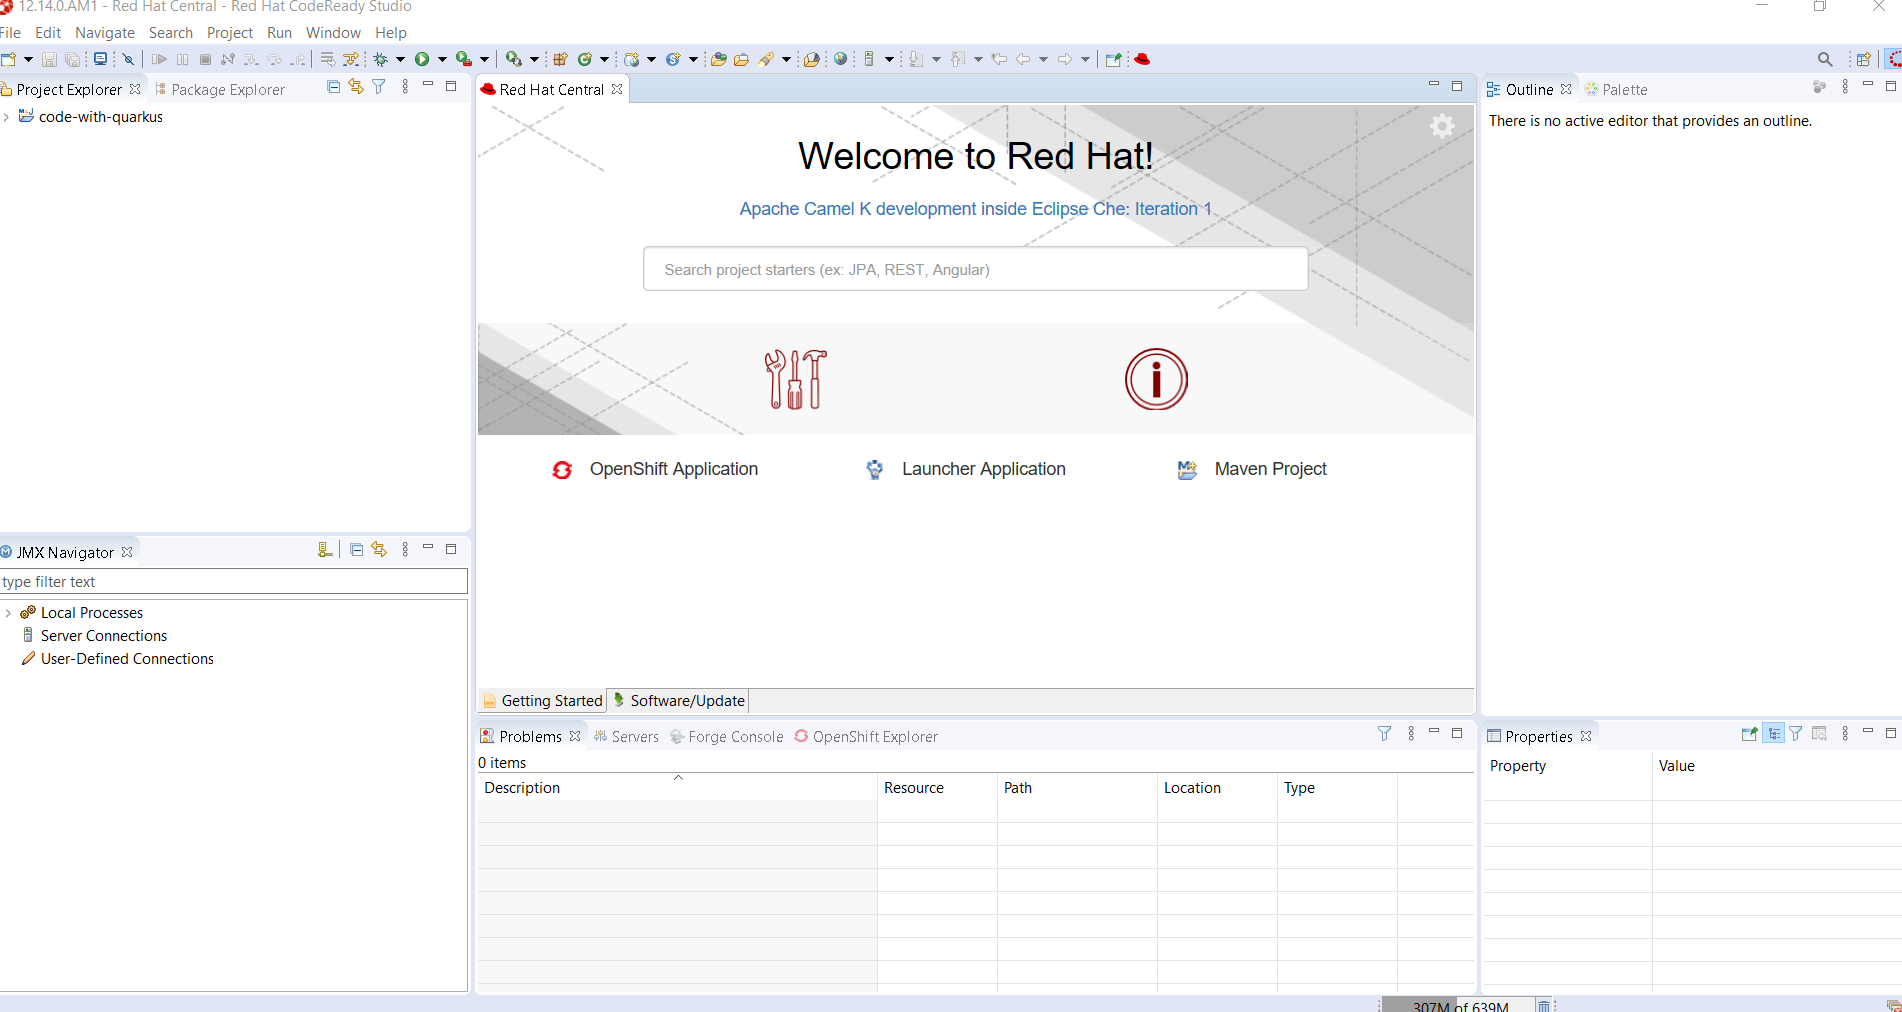
We have successfully created our first Quarkus project. Let’s see now how we can launch this application and debug it.
Running the Quarkus application
Running a Quarkus application can be done from the workbench Run configurations. Select the Run → Run Configurations… menu to display the dialog allowing to create a Run configuration.
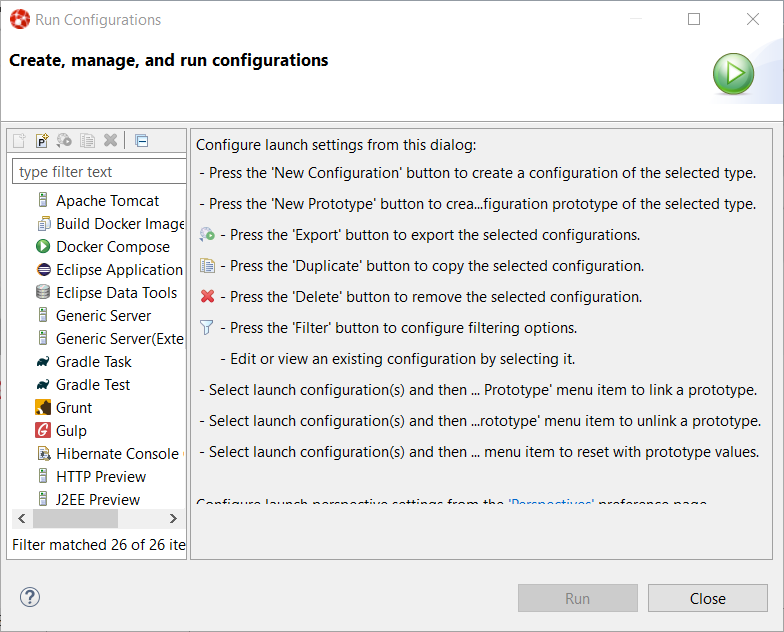
Scroll down until the Quarkus Application is visible and select it:
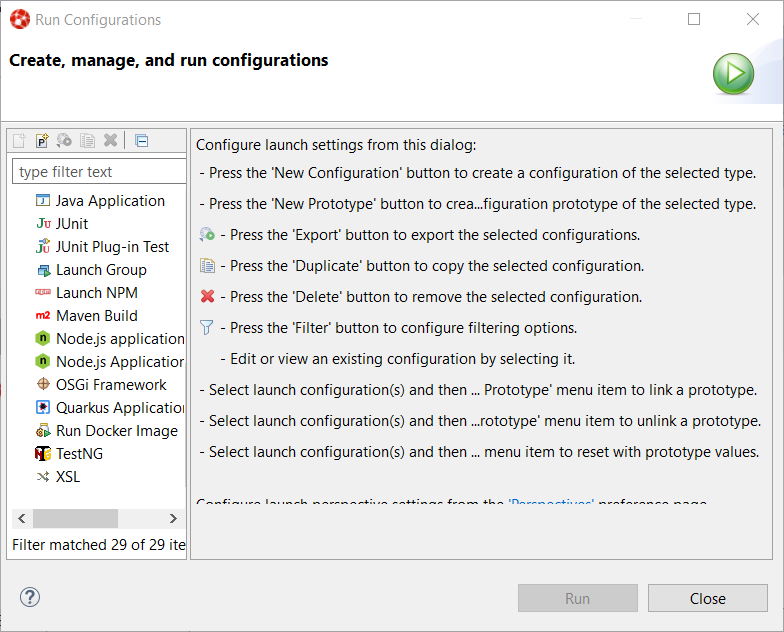
Click on the New configuration button (top left):
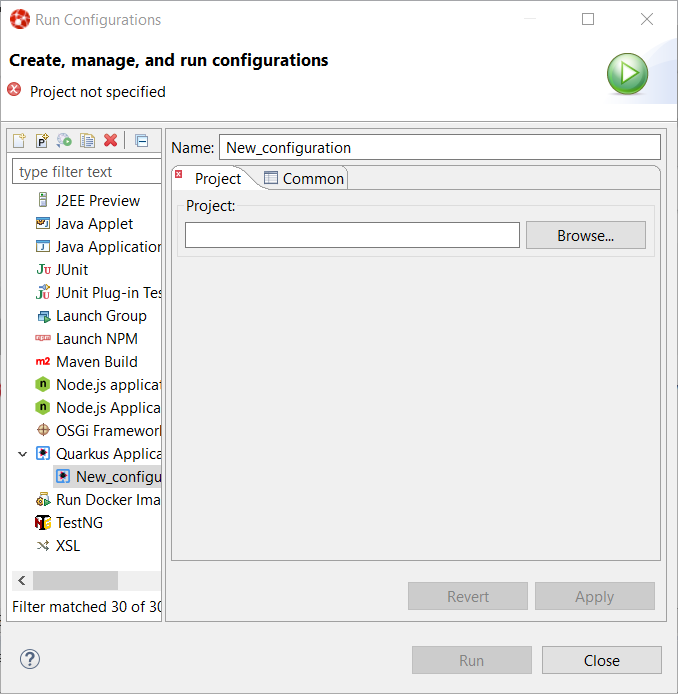
A workspace project needs to be associated with the configuration so click on the Browse button to see the project selection dialog:
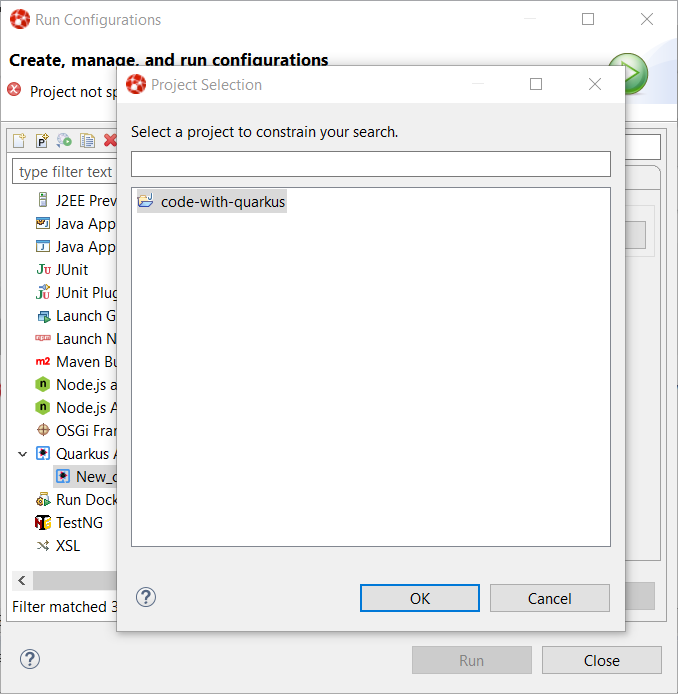
As the workspace contains a single project, it is automatically selected and we can click on the OK button:
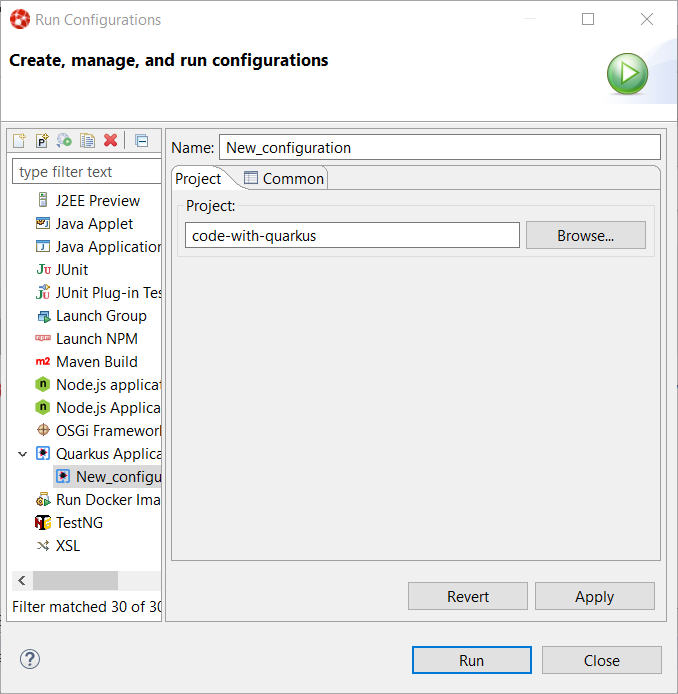
The configuration is now ready to be used. So let’s start our Quarkus application by clicking on the Run button:
You should see a new Console being displayed.

The application is being built and after a while, it will be started:

Debugging the Quarkus application
Debugging a Quarkus application is just a simple as launching the previous configuration we’ve just created in Debug. You just need to open the Run → Debug Configurations…. menu and click on the Debug button.
It will start the Quarkus application like in the previous paragraph but also connect a remote JVM debug configuration to your running Quarkus application. So if you have set breakpoints in your application source files, the execution will automatically stops there.
application.properties content assist
Every Quarkus application is configured through a configuration called application.properties.
The content of this configuration file is dependent of the set of Quarkus extensions that your application is using. Some settings are mandatory, some others are not and the possible values are specific to the nature of the setting: boolean, integer, limited set of values (enumerations).
So, as a developer, you need to look at various guides and documentations (the core Quarkus and the extension specific ones)
So Quarkus Tools provides content assist on those specific files that:
-
validates the content of the application.properties files
-
provides you with the possible setting names and values
Let’s see it in action.
Go to src/main/resources/application.properties in the project and right click and select Open With → Generic Text Editor:
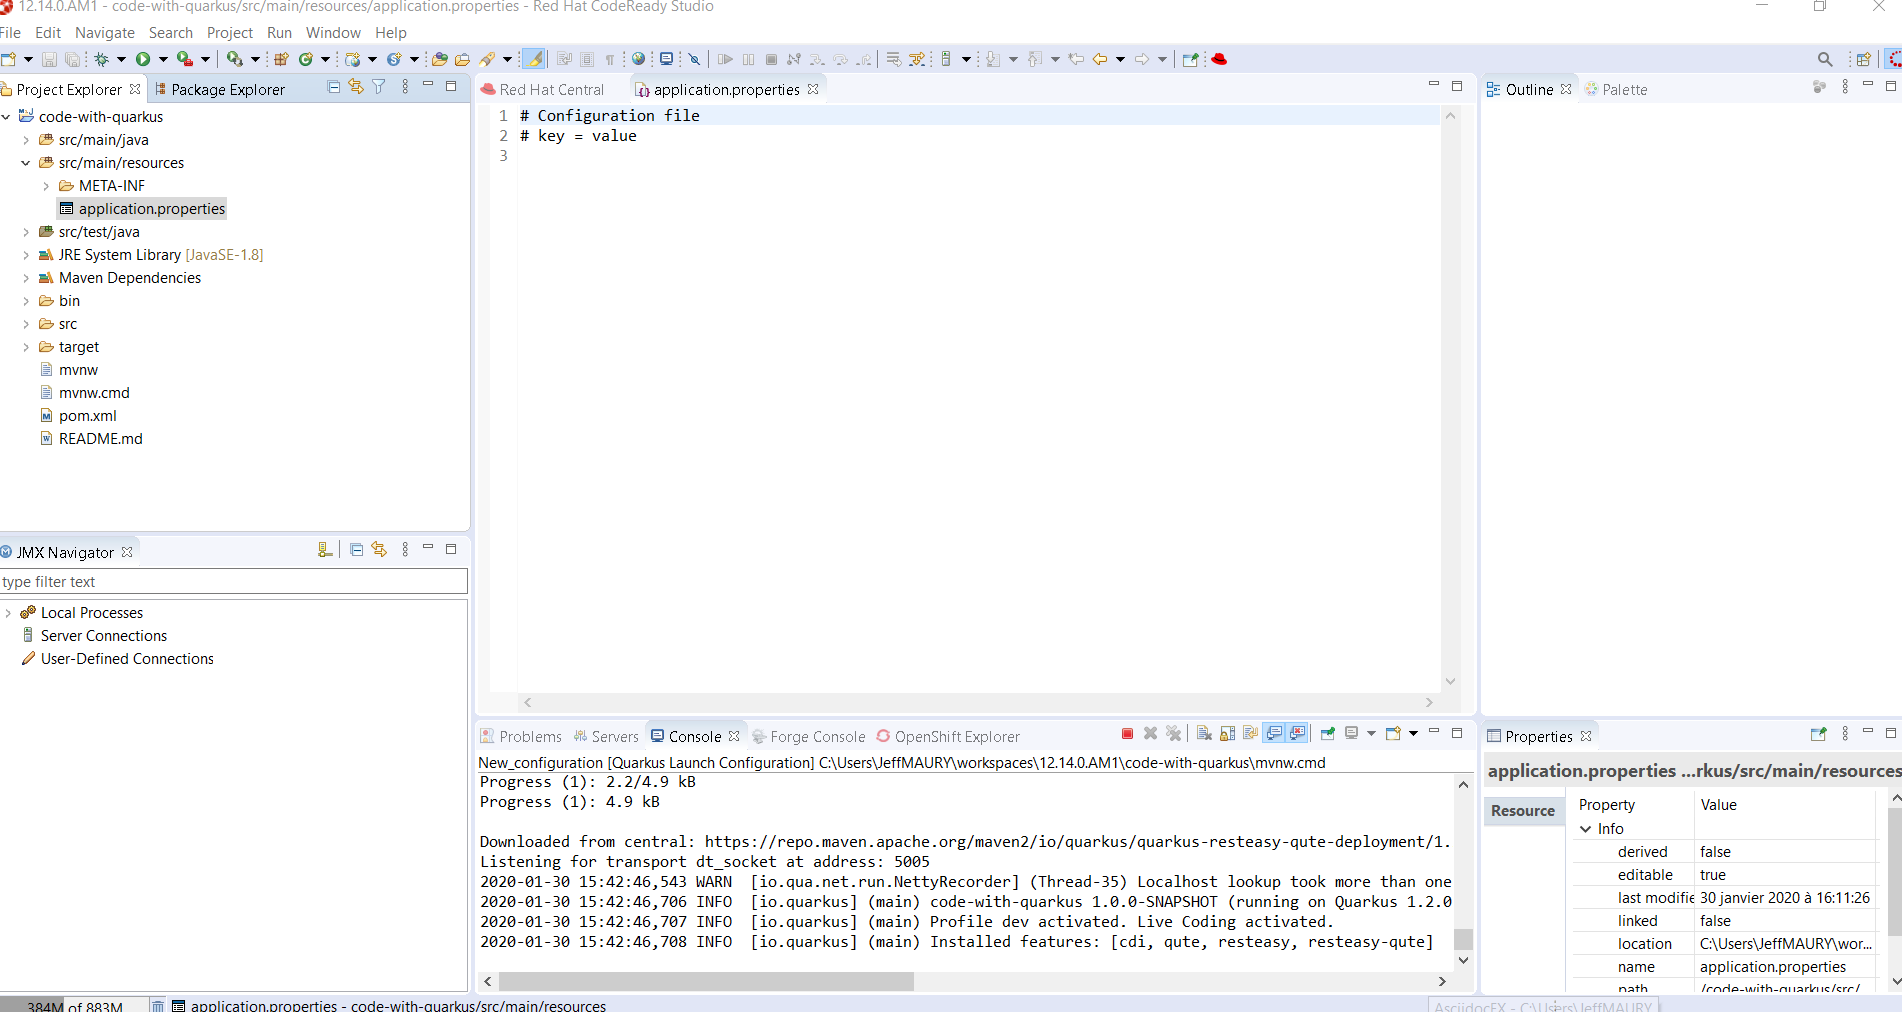
Go the third line of the file and invoke code completion (Ctrl + Space):
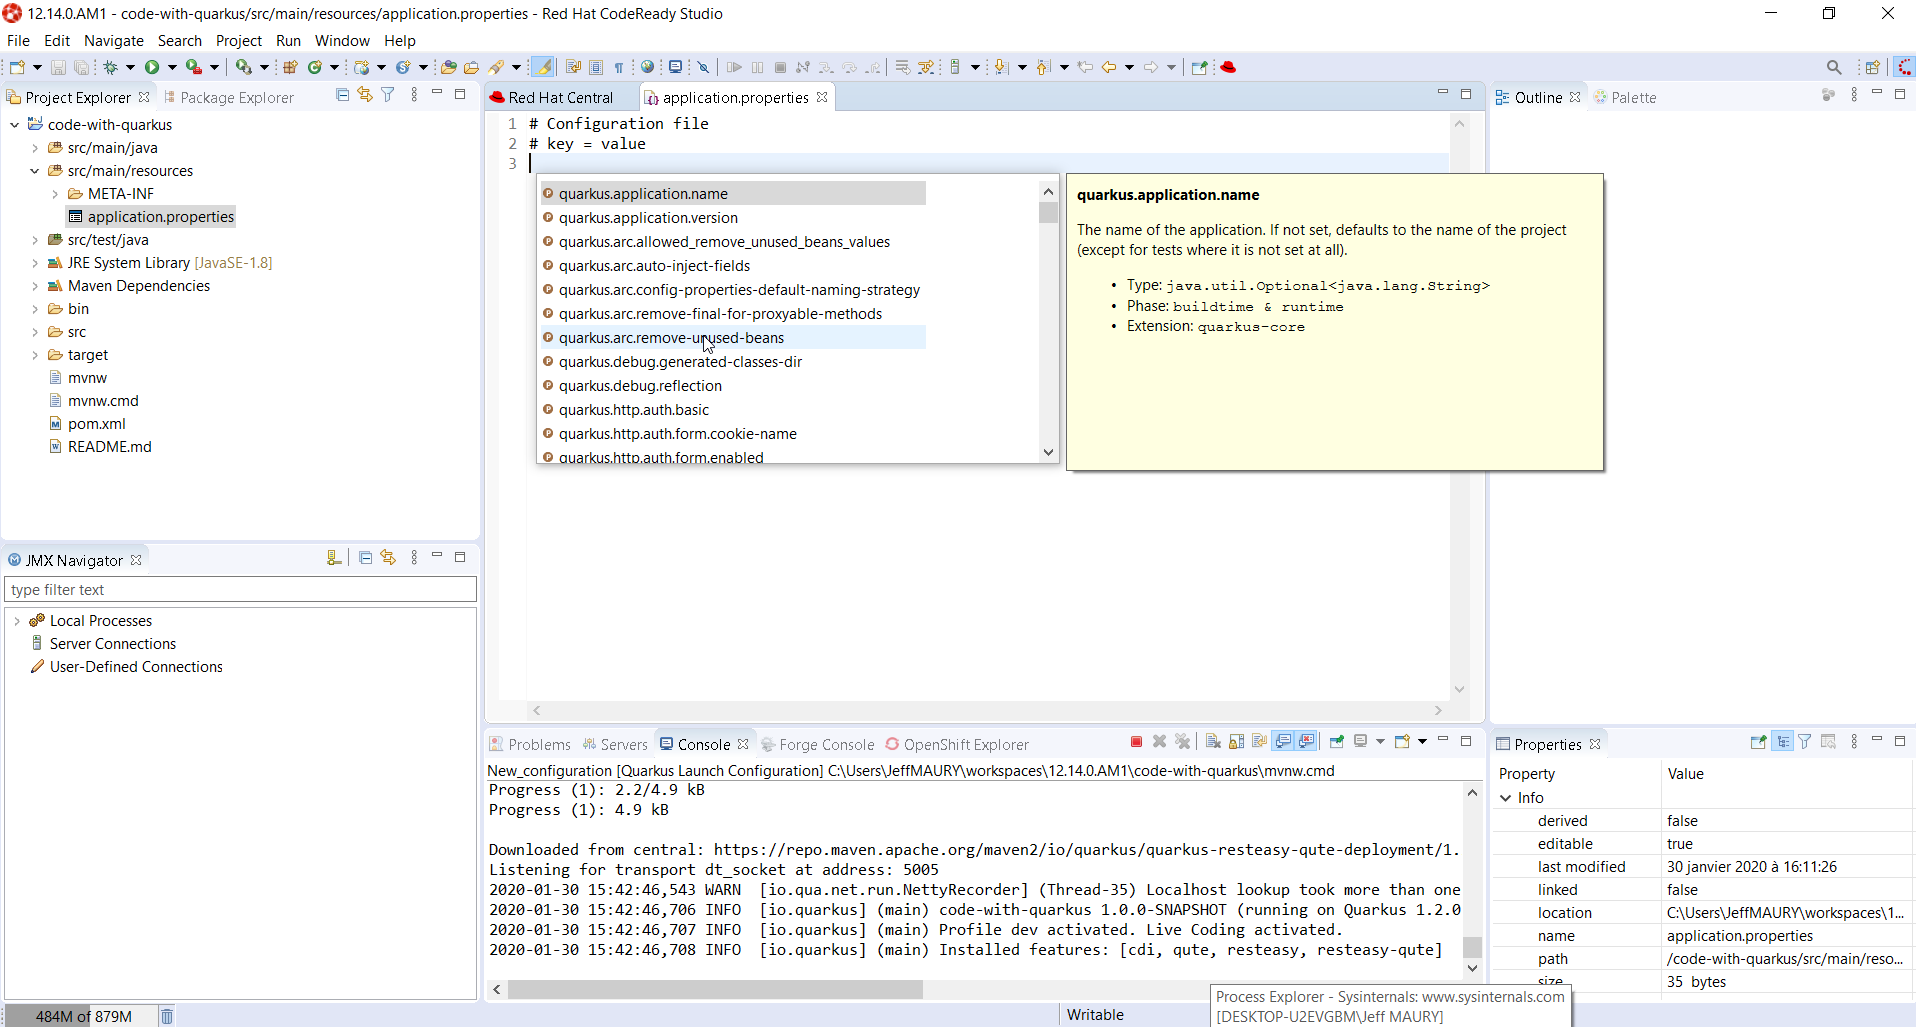
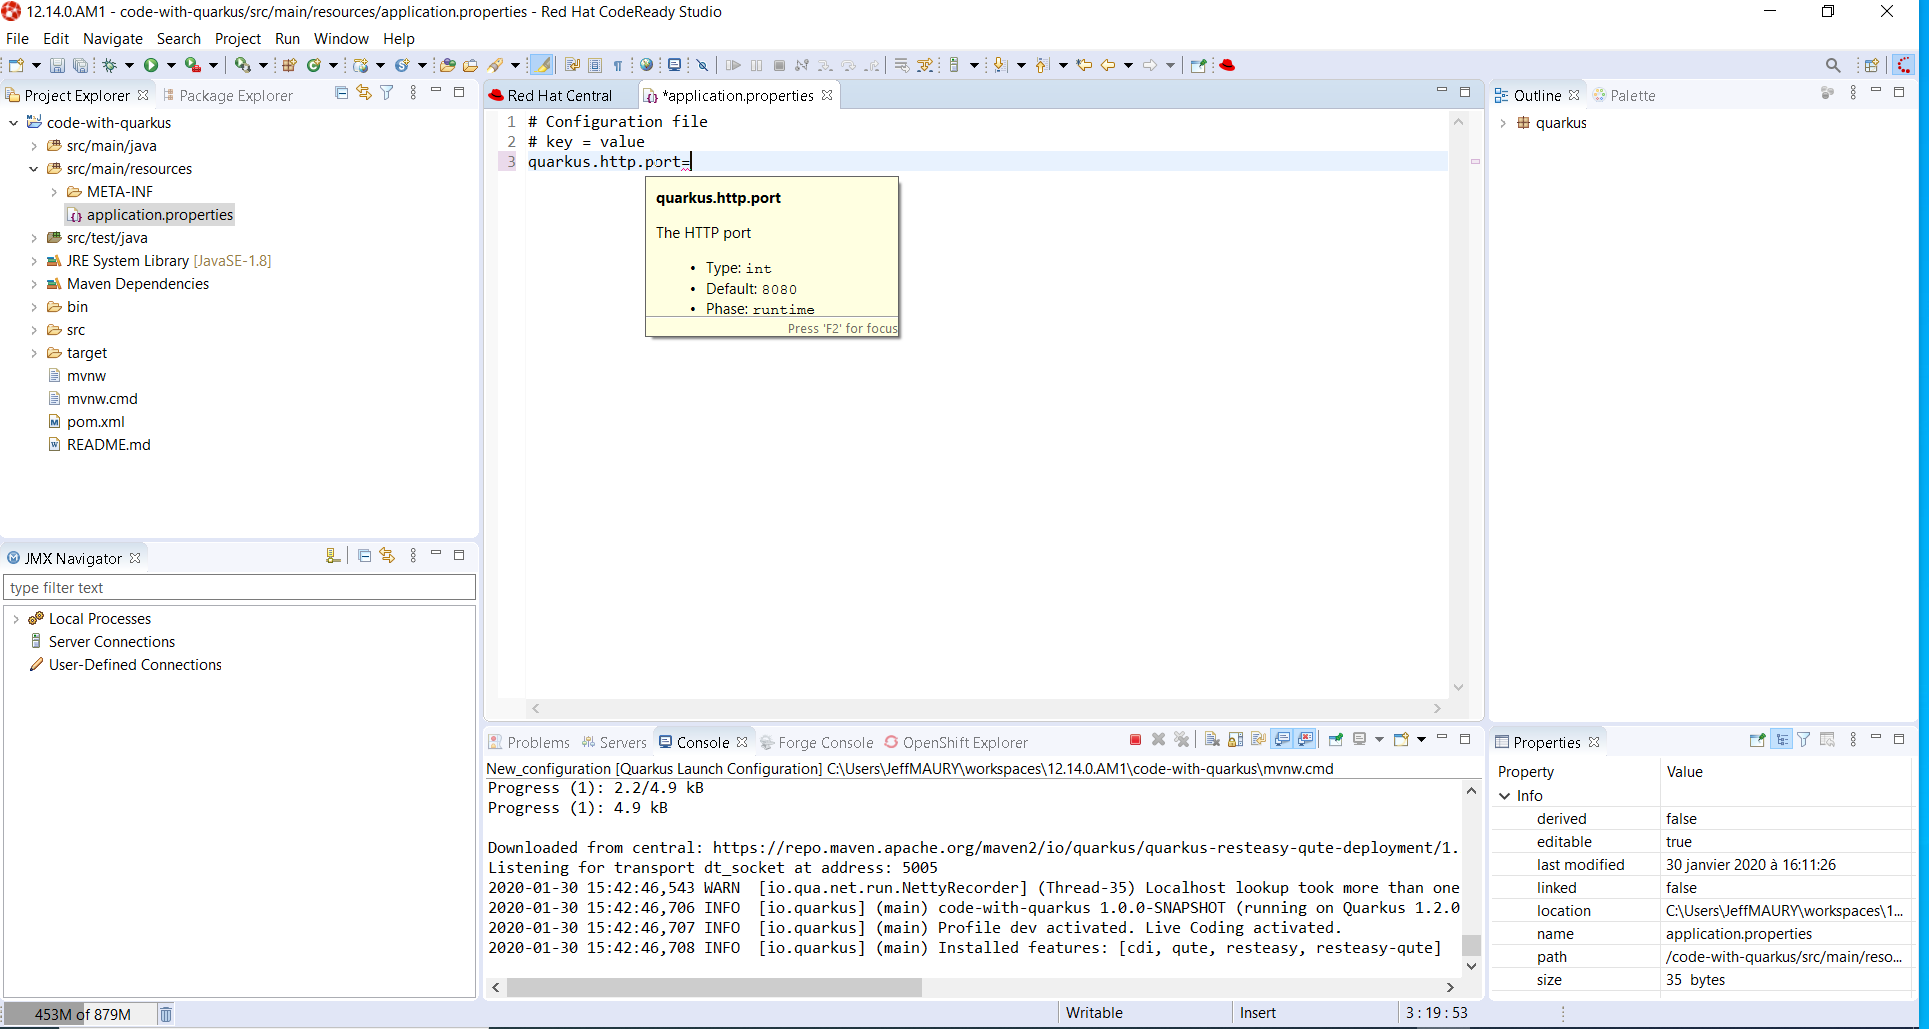
For each setting, a documentation is displayed when you mouse over the setting. Let try to add quarkus.http.port to the file and mouse over this name:
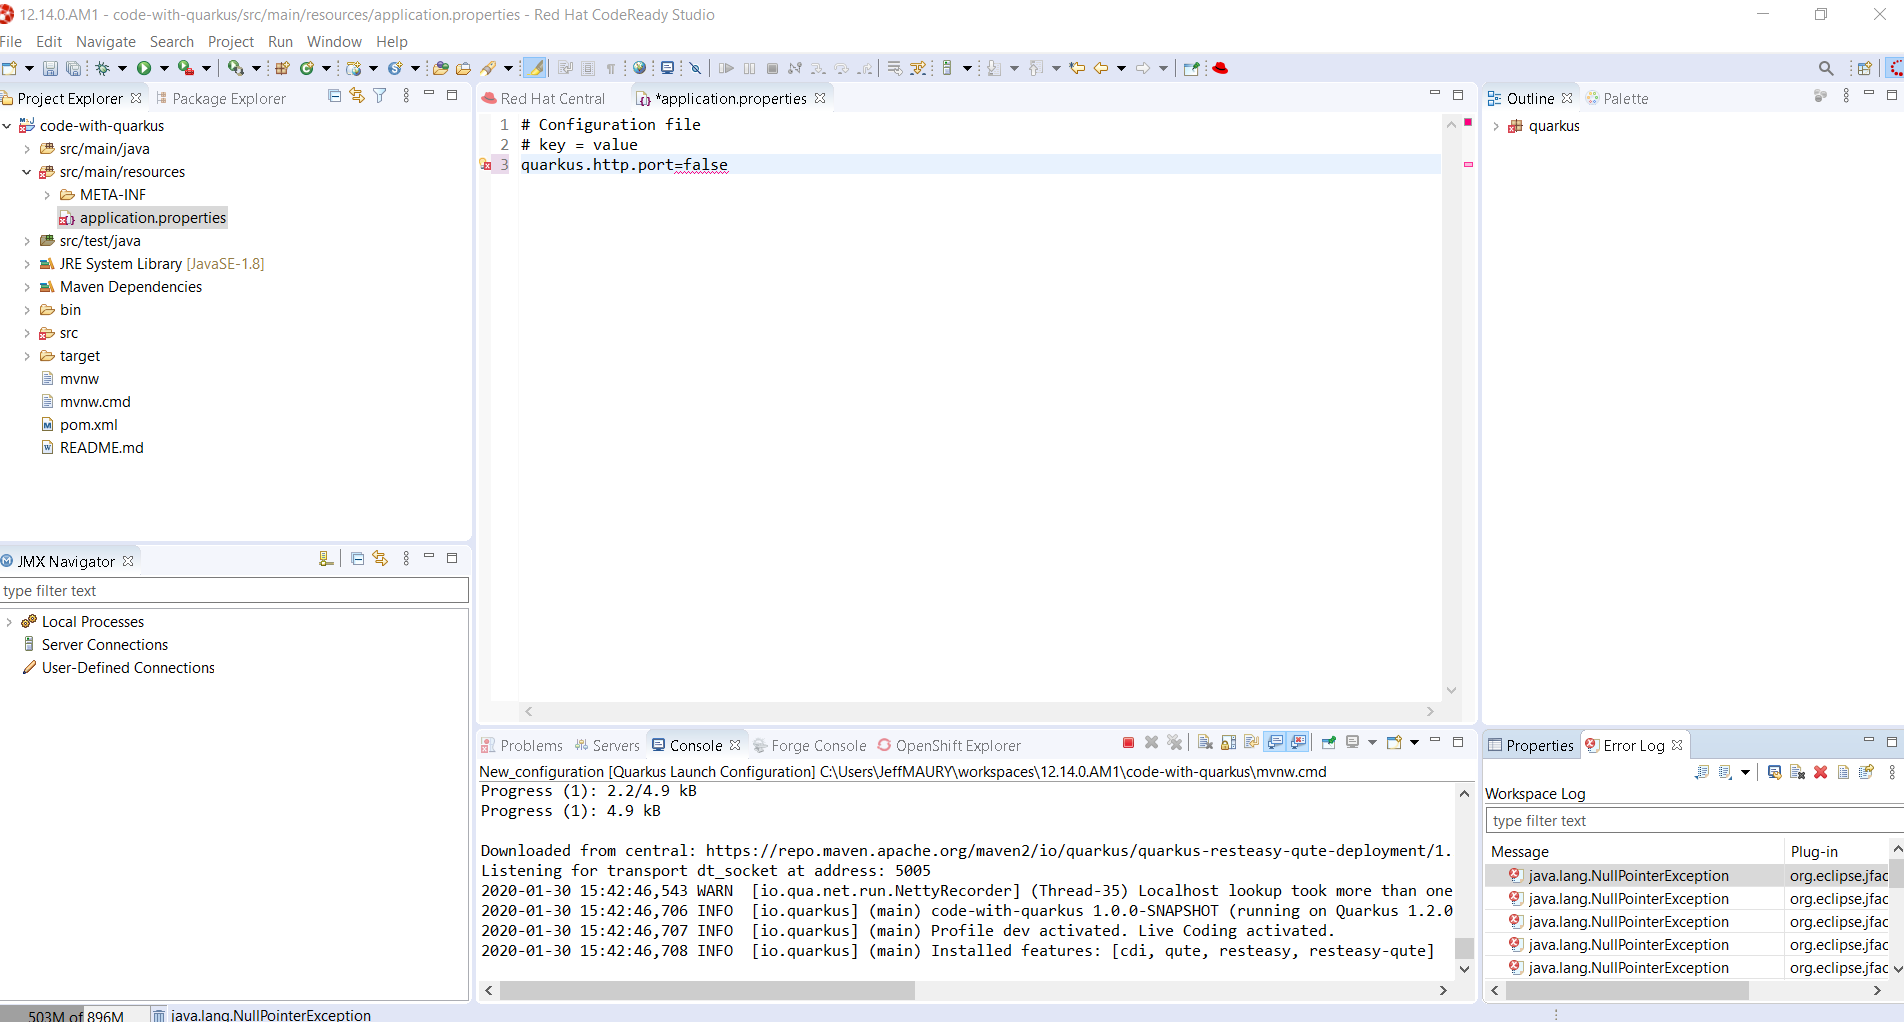
If we enter a wrong value (false instead of a numeric value), then the error will be highlighted:
This is the first set of features that will be integration into the next version of JBoss Tools. We encourage you to used it and if you are missing features and/or enhancements, don’t hesitate to report them here: JBoss Tools issue tracker
Hibernate Tools
Deprecation
The Forge, Java Server Tools (JST) and Visual Page Editor (VPE) have been deprecated. Even though they received an update with this release, we have no plan to maintain or add new features and they may be removed in the future.
In addition, the adapters for Red Hat JBoss Enterprise Application Server 4.3 and 5.0 have also been deprecated.
Platform
Views, Dialogs and Toolbar
New view menu icon
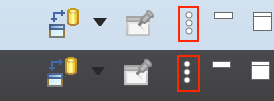
The view menu chevron icon (▽) is replaced by a modern equivalent, the vertical ellipsis ( ⠇).
Almost every view has a menu that may contain additional configuration settings like filters, layout settings, and so on. The view menu was often overlooked and we expect that this change will help users to find it.
Find Actions: The improved Quick Access
The formerly called Quick Access action has been retitled to Find Actions to better emphasize its goal.
The related UI has changed a bit to improve its usage and accessibility:
-
The widget item is now a regular toolbar item (button-like)
-
An icon is shown
-
Right-clicking on the tool item works and shows typical actions, including Hide
-
The proposals are now a regular dialog, centered on the workbench
These changes will greatly improve the experience if you’re using a screen reader as it relies on a more standardized focus state. This also leverages all the default and usual accessibility features of dialogs (moveable, resizable…).
Loading the proposals has been improved as well to avoid UI freezes when loading proposals.
Find Actions finds text in file contents
Find Actions is now extended by the Quick Text Search feature to show the potential text matches in file contents also in the proposals.
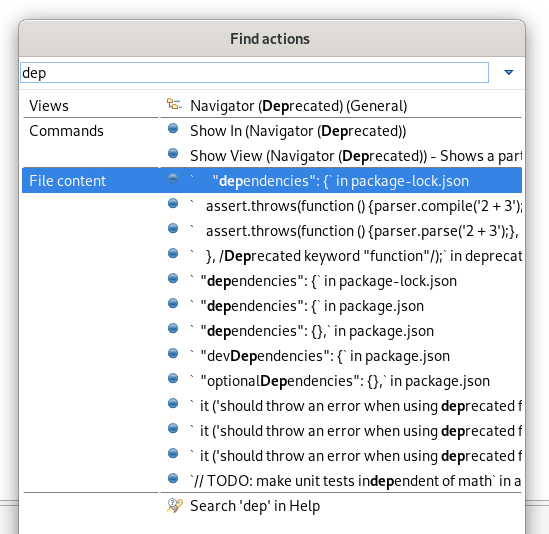
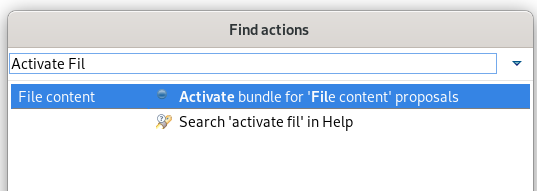
If the Quick Text Search bundle wasn’t started yet, you may miss those matches. In this case, you can use Find Actions itself to activate the Quick Text Search by finding and selecting the Activate bundle for 'File content' proposals entry.
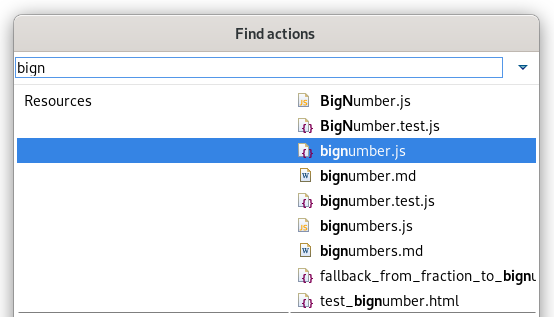
Find Actions lists workspace files
Find Actions can now list matching file names from the workspace (similar to the Open Resource dialog). Upon selection the file is opened in the editor.
Inline rename for simple resources while in Project Explorer.
In the Project Explorer, renaming (with the F2

In cases where other files are affected by the rename, or the rename operation is customized, the rename dialog will appear as it previously did.
Text Editors
Show problem markers inline
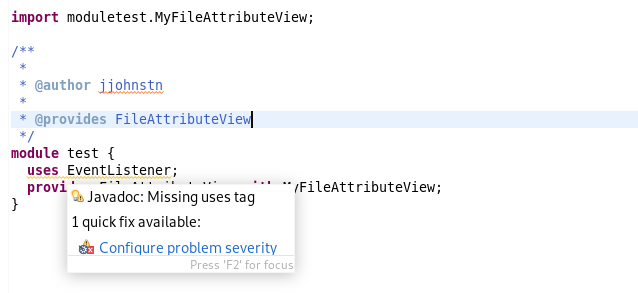
You can now see the errors, warnings, and info markers inline in most of the text editors. No more mousing around to see the actual error message!
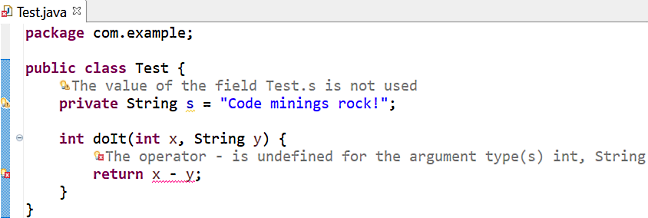
You can see the available quick fixes by clicking on the message.
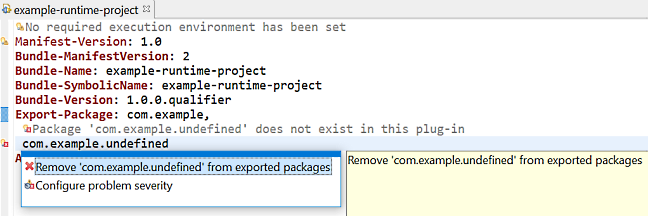
You can enable it on the General > Editors > Text Editors preference page and set Show Code Minings for Annotations to:
-
None (default)
-
Errors only
-
Errors and Warnings
-
Errors, Warnings and Info
Backspace/delete can treat spaces as tabs
If you use the Insert spaces for tabs option, now you can also change the backspace and delete keys behavior to remove multiple spaces at once, as if they were a tab.
The new setting is called Remove multiple spaces on backspace/delete and is found on the General > Editors > Text Editors preference page.

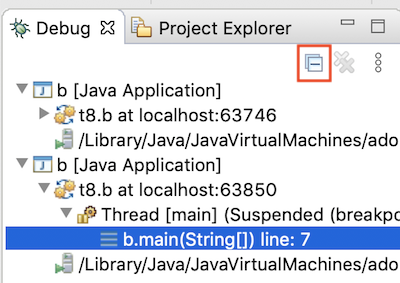
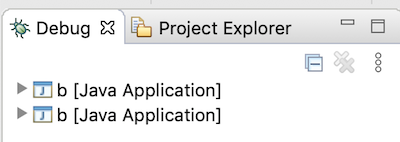
Debug
Themes and Styling
Improvements in UI Forms Styling
CSS customization of ExpandableCompositeSection
Old:

New:

Java Developement Tools (JDT)
Java 13 Support
Java 13
Java™ 13 is available and Eclipse JDT supports Java 13 for the Eclipse 4.14 release.
The release notably includes the following Java 13 features:
-
JEP 354: Switch Expressions (Preview).
-
JEP 355: Text Blocks (Preview).
Please note that these are preview language feature and hence enable preview option should be on. For an informal introduction of the support, please refer to Java 13 Examples wiki.
Keyboard shortcut for Text Block creation
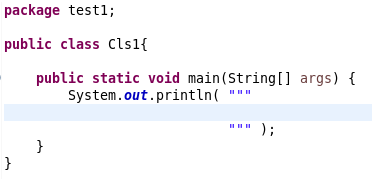
A keyboard shortcut Ctrl + Shift + ' is added in the Java Editor for text blocks, which is a preview feature added in Java 13.
Conditions under which this keyboard shortcut works are:
-
The Java Project should have a compliance of 13 or above and the preview features should be enabled.
-
The selection in the editor should not be part of a string or a comment or a text block.
Examples:
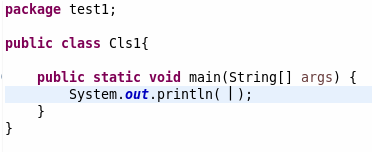
Pressing the shortcut gives:
You can also encompass a selected text in text block as below:
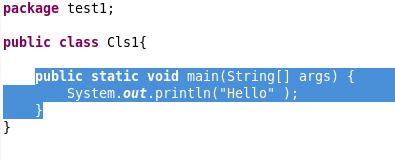
On pressing the shortcut, you get this:
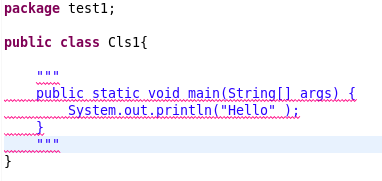
Java Editor
Remove unnecessary array creation
A new cleanup action Remove unnecessary array creation has been added. It will
remove explicit array creation for varargs

For the given code:
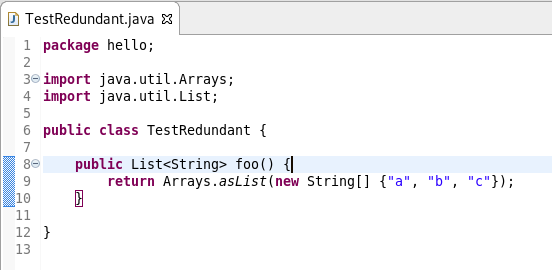
After cleanup, you get this:

Push negation down in expression
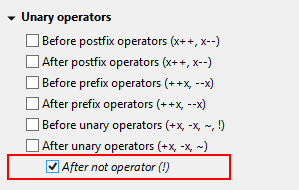
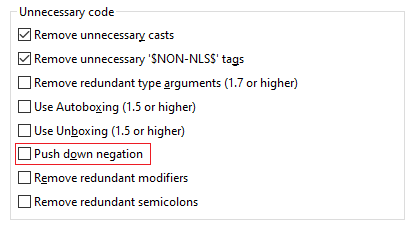
A new Java cleanup/save action Push down negation has been added. It reduces the double negation by reverting the arithmetic expressions.
For instance:
!!isValid; becomes isValid;
!(a != b); becomes (a == b);
Provide templates for empty Java source files
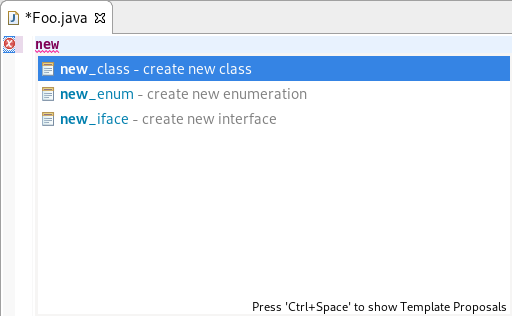
When dealing with empty Java source files, some basic templates (class, interface, enum) will now be available from the content assist popup.
Postfix completion proposal category
Postfix completion allows certain kinds of language constructs to be applied to the previously entered text.
For example: Entering "input text".varString name = "input text"

try-with-resources quickfix
A quickfix has been added to create a try-with-resourcesAutoCloseabletry-with-resources
If there are selected statements that are not eligible resources (such as Objects
that don’t implement AutoCloseabletry-with-resources
Method before applying try-with-resources:

Select all the lines inside the method, then use the short-cut Ctrl+1 and click on Surround with try-with-resources from the list:
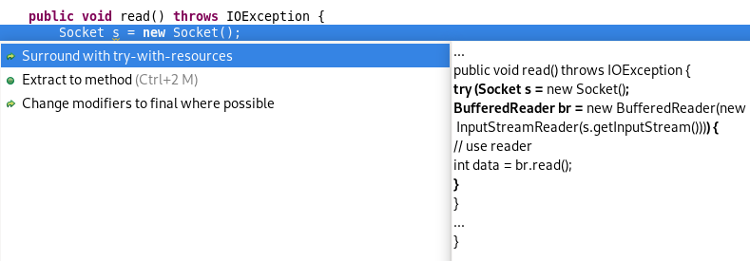
This results in:

Java Formatter
Formatting of text blocks
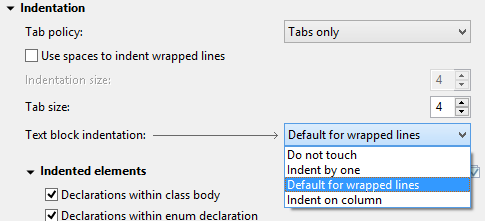
The code formatter can now handle text blocks, which is a preview feature added in Java 13. It’s controlled by the Text block indentation setting, found right in the Indentation section of the Profile Editor (Preferences > Java > Code Style > Formatter > Edit…).
By default, text block lines are indented the same way as wrapped code lines, that is with two extra tabs relative to the starting indentation (or whatever is set as Default indentation for wrapped lines in the Line Wrapping section). You can also set it to use only one tab for indentation (Indent by one), align all lines to the position of the opening quotes (Indent on column), or preserve the original formatting (Do not touch).
Blank lines between Javadoc tags
The code formatter can now divide Javadoc tags into groups (by type, for example
@param@throws@returns
Debug
No suspending on exception recurrence
A new workspace preference has been added for exception breakpoints: Suspend policy for recurring exception instances controls whether the same exception instance may cause the debugger to suspend more than once.
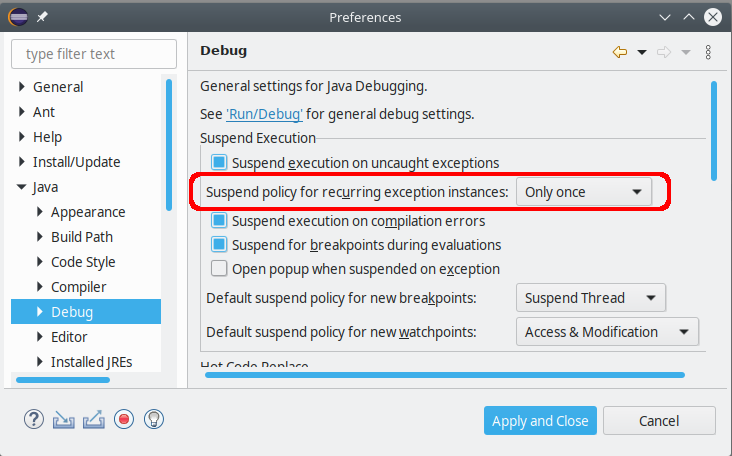
This option is relevant when debugging an application that has trythrowcatchfinallytry-with-resources
When the debugger stops due to an exception breakpoint, you may want to continue
your debug session by pressing Resume (F8), but all that catching and re-throwing
will force you to observe all locations where the same exception will surface again
and again. Suspending at all try
The JDT Debugger will now detect this situation, and the first time it notices the same exception instance recurring at the surface, a new question dialog is shown:

If you select Skip in this dialog, the current exception instance will be dismissed for good. Still, new instances of the same exception type will cause suspending when they are thrown.
If you check Remember my decision your choice will be stored in the mentioned workspace preference to be effective for all exception breakpoints.
Even after choosing Skip — resp. Only once in the preferences — you can have the old behavior simply by pressing Step Return (F7) instead of Resume.
JDT Developers
Flag whether content assist extension needs to run in UI thread
The existing org.eclipse.jdt.ui.javaCompletionProposalComputerorg.eclipse.jdt.ui.javadocCompletionProposalComputerorg.eclipse.jdt.ui.javaCompletionProposalSorters
This information will be used by the Content Assist operation to allow some optimizations and prevent UI freezes by reducing the amount of work happening in the UI thread.
To preserve backward compatibility, the default value for this attribute (if unset)
is true
And more…
You can find more noteworthy updates in on this page.
