What's New in 4.14.0.Final
Hibernate Tools
OpenShift
OpenShift Container Platform 4.3 support
With the new OpenShift Container Platform (OCP) 4.3 now available (see this article), JBoss Tools is compatible with this major release in a transparent way. Just define your connection to your OCP 4.3 based cluster as you did before for an OCP 3 cluster, and use the tooling !
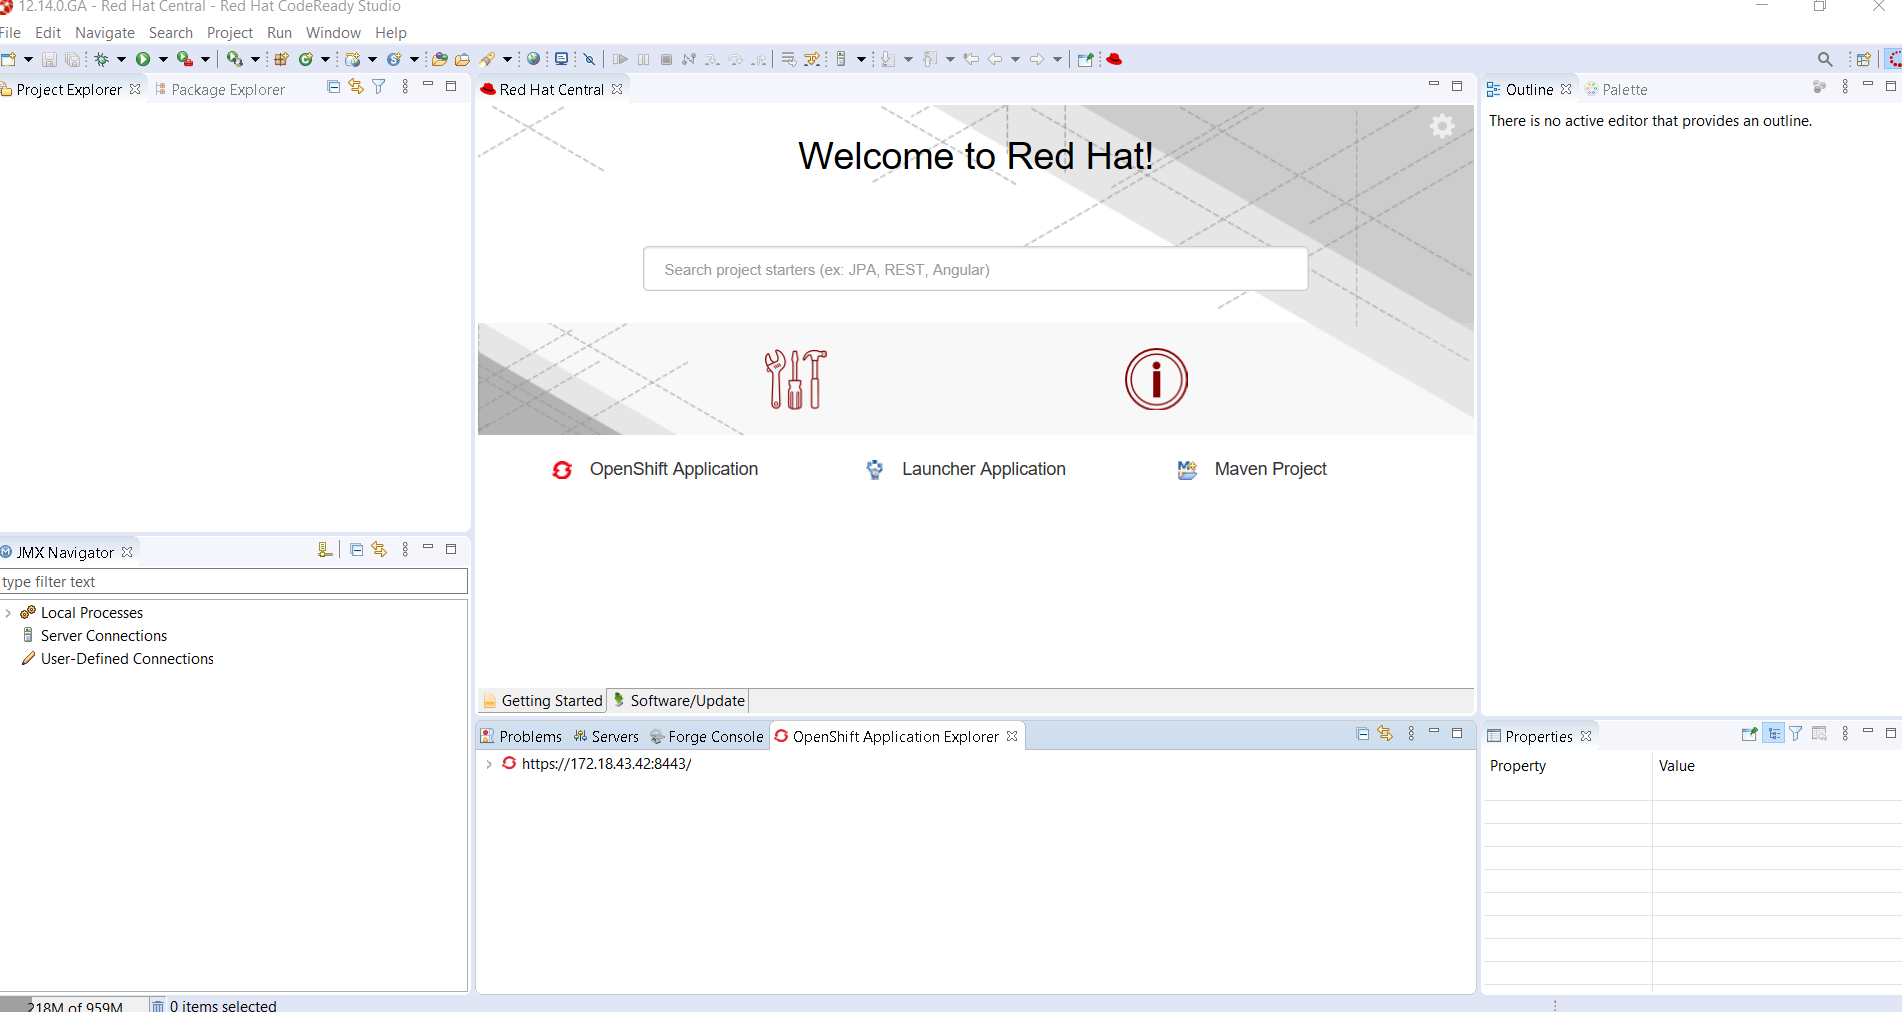
New OpenShift Application Explorer view
A new OpenShift Application Explorer window has been added in addition to the OpenShift Explorer. It is based on OpenShift Do. It provides a different and simplified user experience allowing easy and rapid feedback through inner loop and debugging.
Let’s see it in action.
Opening the OpenShift Application Explorer view
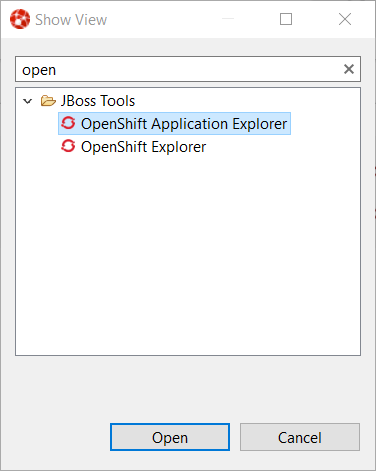
If you opened a brand new workspace, you should see the OpenShift Application Explorer view in the list of views available on the botton part of the screen:

If you don’t see the view being listed, you can open it
through the Window -→ Show View -→ OtheropenOpenShift Application Explorer
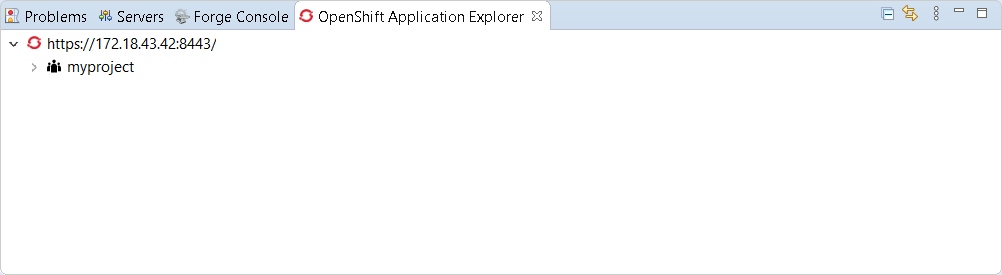
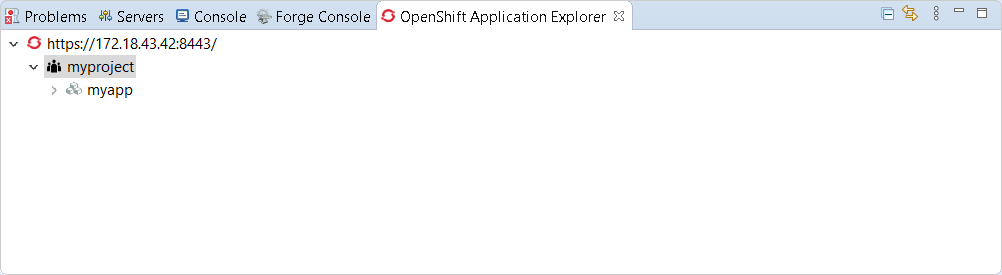
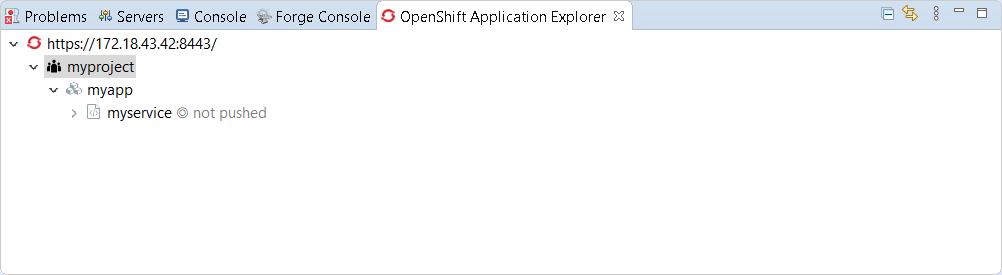
Expanding the root node will display the list of projects available on the cluster:
Java based micro service
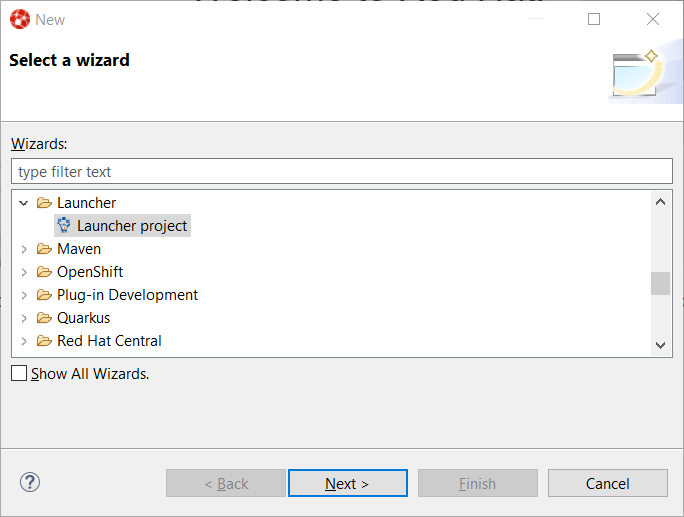
We will show how to deploy a Java based microservice and
how to use the various features. But we first need to load
the component source code in our workspace. Thanks to the
launcher wizard, we can do that easilly. Try Ctrl+NLauncher project
Then click the Next
Select rest-httpMissionvert.x communityRuntimemyserviceProject name
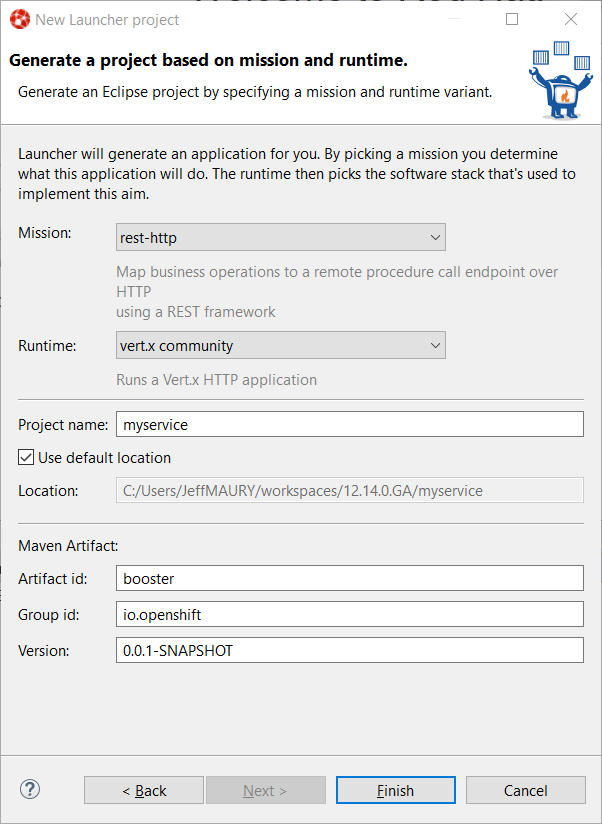
Then click the Finish
Create the component
Now that we have the source code, we can create the component. From the OpenShift Application Explorer view,
right select the project (myproject), and the click the
New → Component
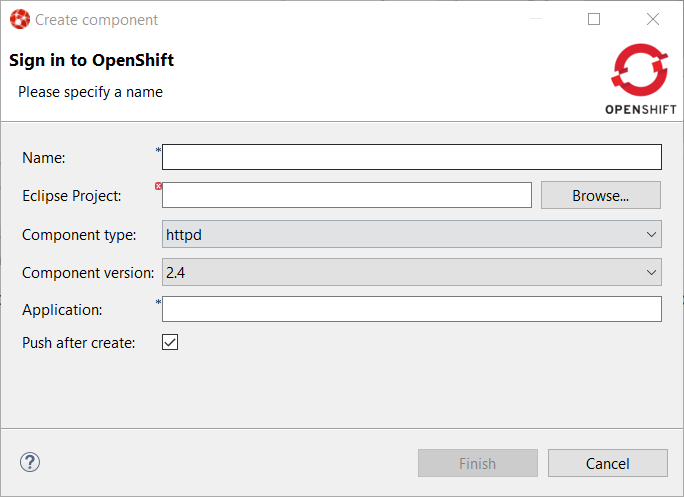
Enter myserviceNameBrowsejavaComponent type8Component versionmyappApplicationPush after create
Then click the Finish
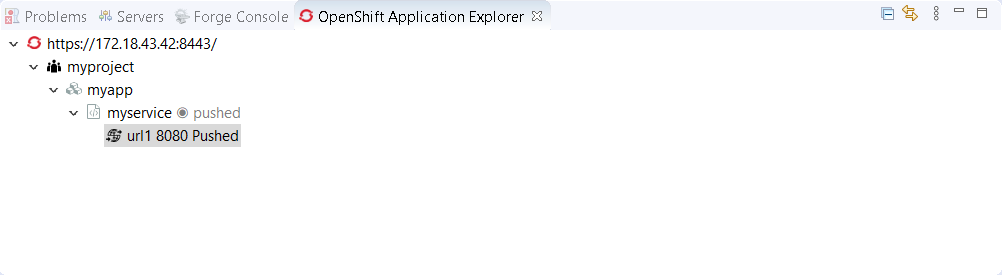
Expanding the application will now display our component:
The component has been created but it is not yet deployed on the cluster (as we
unchecked the Push after createPushConsole
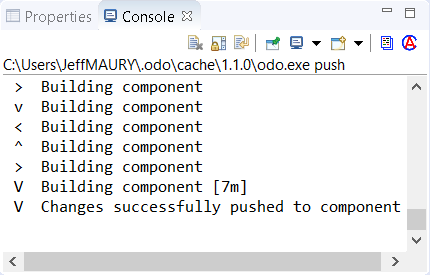
The component is now deployed to the cluster but we cannot access it as we need
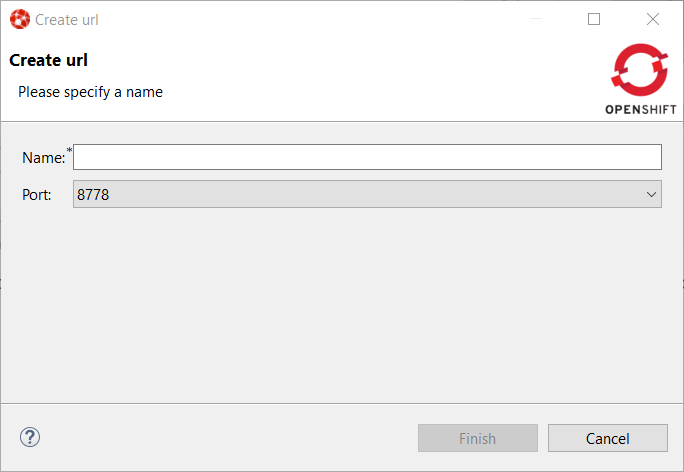
to define an URL to access it externally. Right select the component and click
the New → URL
Enter url1Name8080Port
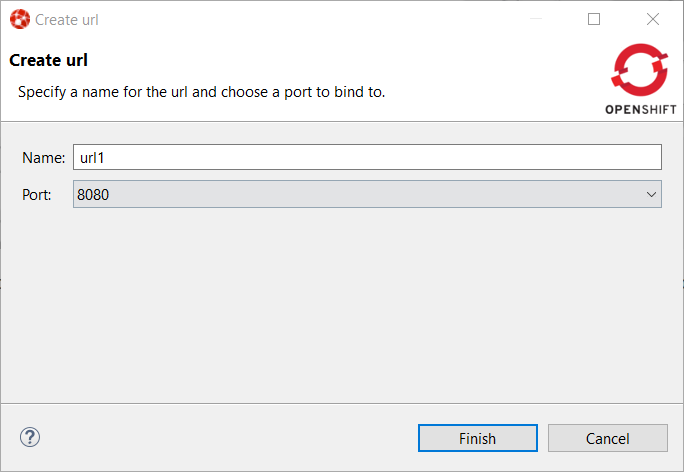
Then click on the FinishConsole
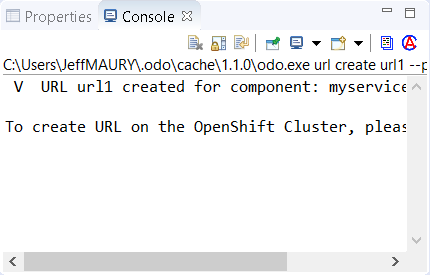
So push the component again (component → Push
Let’s check that we can now access the service. Expand the component level so that we can see the URL we have just created:
Right select the URL and click the Open in Browser
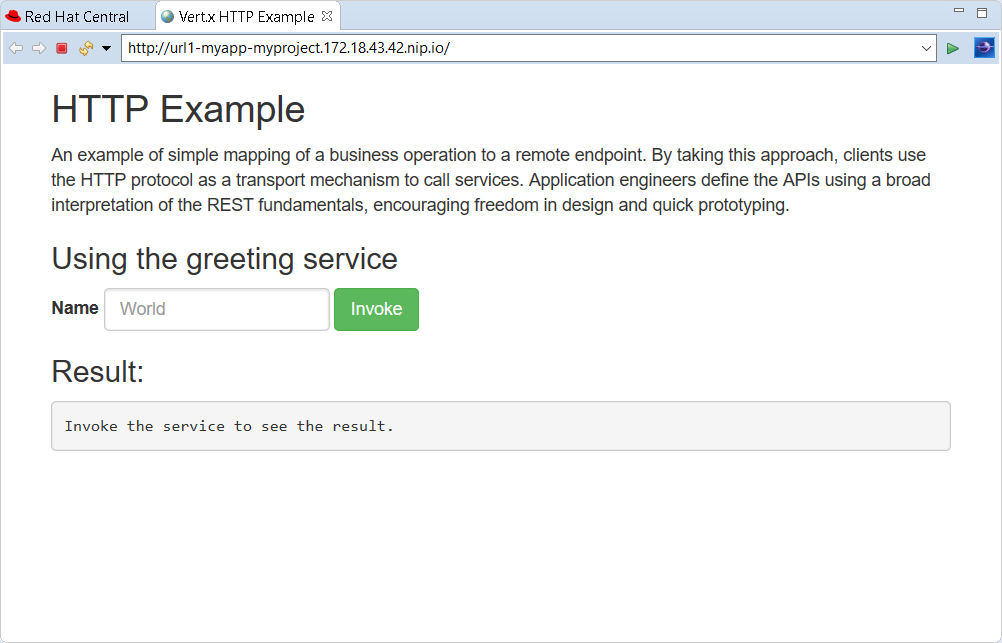
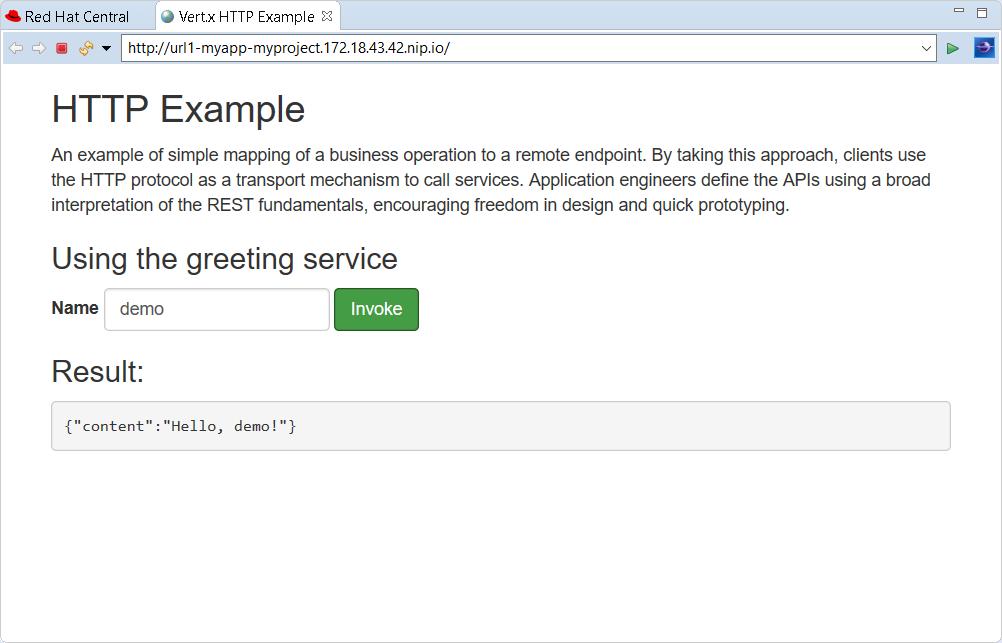
You can test the service: enter demoInvoke
Feedback loop
We will now see how we can get fast feedback on code changes. So let’s modify the application code and see how we can synchronize the changes to the cluster.
In the Project ExplorerHttpApplication.java
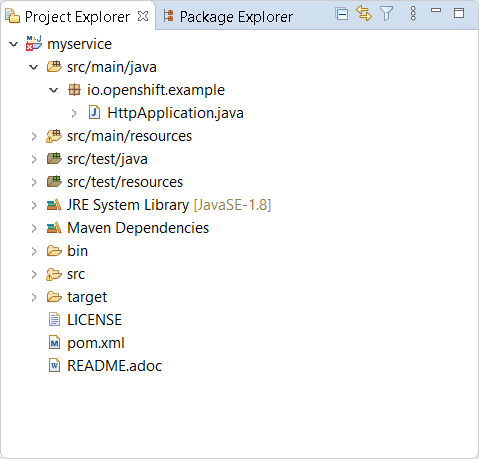
Double click on the file to open the editor:
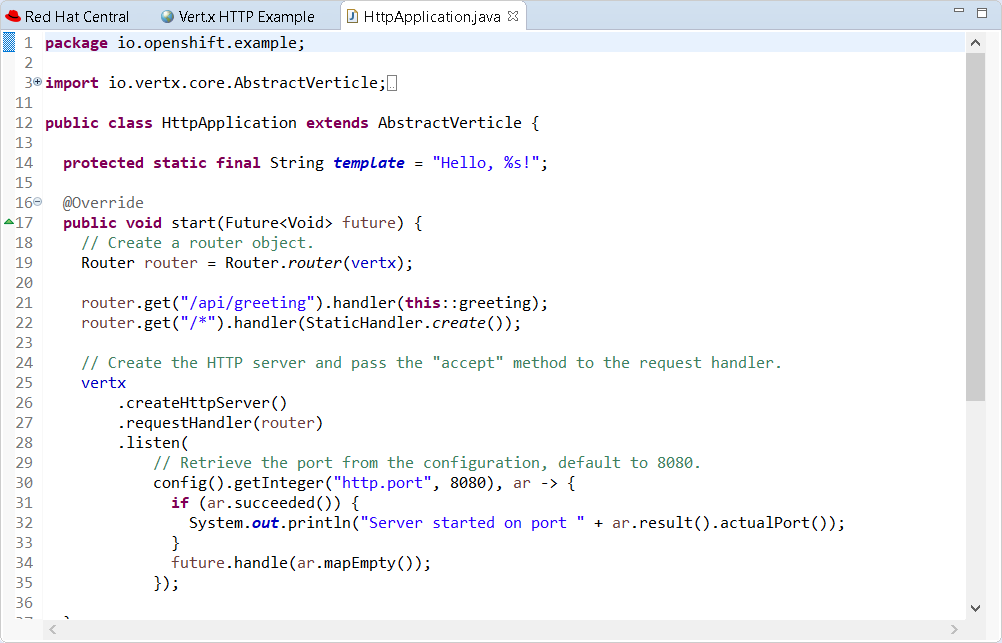
On line 14, change the line:
protected static final String template = "Hello, %s!";to
protected static final String template = "Hello, %s!, we modified the code";and press the Ctrl+S
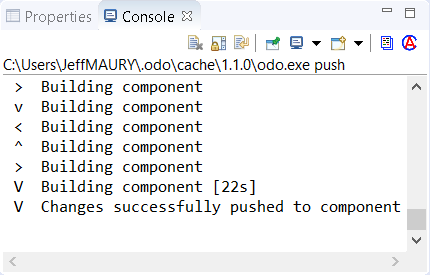
For the OpenShift Application Explorer, right click the component (myservice) and
click the Push
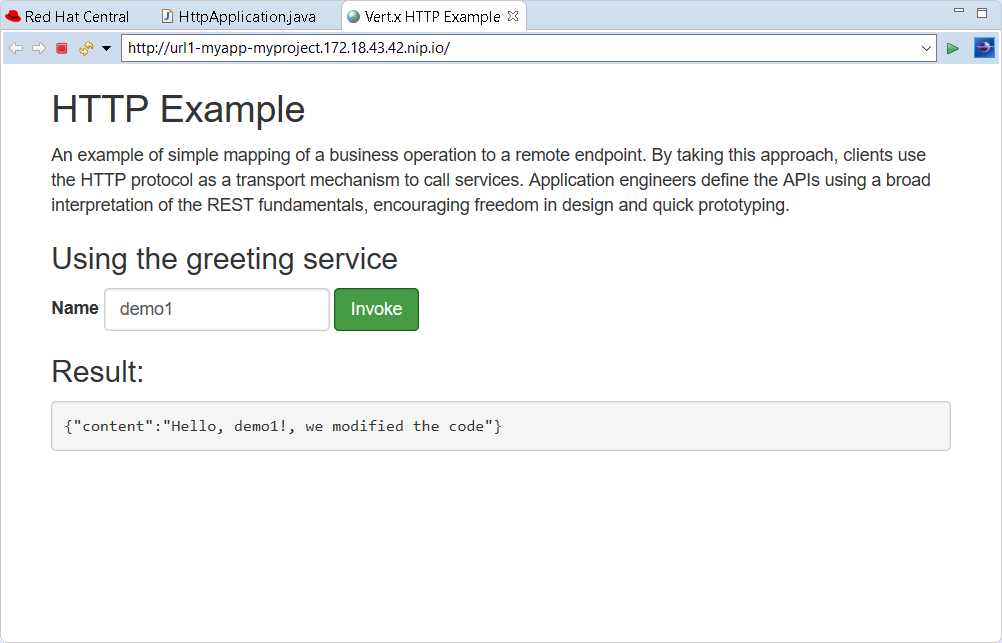
Select the browser window again, enter demo1Invoke
We’ve seen that, through a sequence of code modification(s) followed by a synchronize
action (push) to the cluster, we can get a very fast feedback. If you don’t want to
manually synchronize the the cluster (push), you can opt to automatically synchronize
to the cluster with the Watch
Going further: debug your application on the cluster
Testing an application through code changes is a great achievement so far but it may be difficult for complex applications where we need to understand how the code behaves without the need to use the UI. That’s why the next step is to be able to debug our application live on the cluster.
The new OpenShift Application Explorer allow such a scenario. We will first set up a breakpoint
in our application code. Select again the HttpApplication.javagreeting
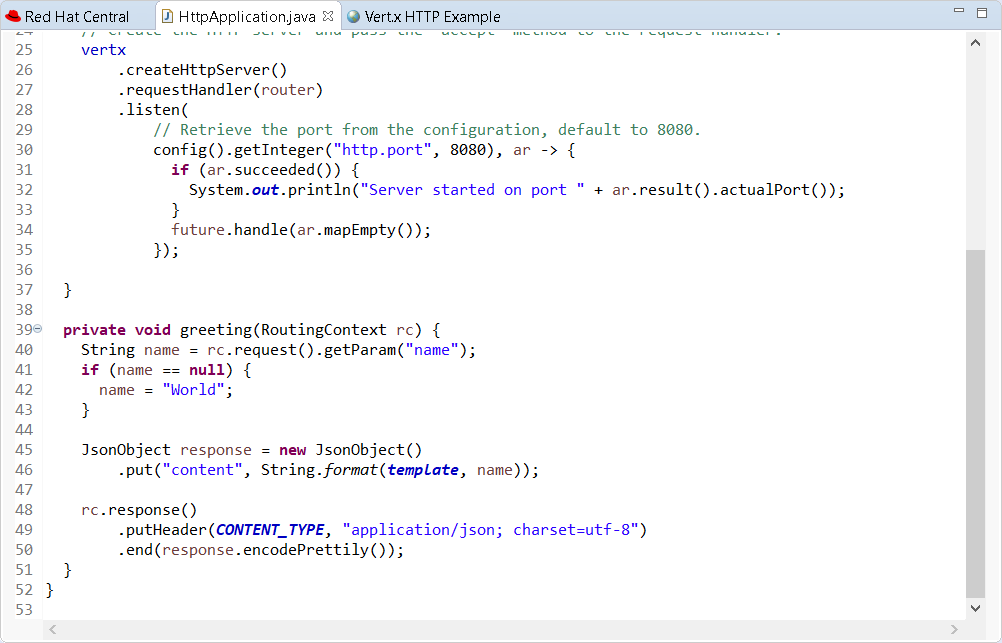
On line 41, double click in the left ruler column so that a breakpoint is set:

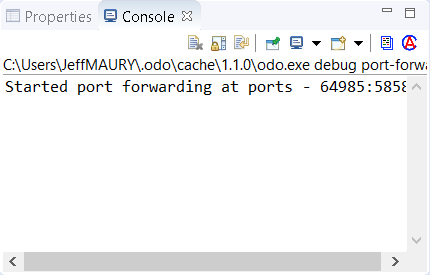
We are now ready to debug our application. In order to do that, we need to launch
a local (Java in our case) debugger that will be connected to our application on the
cluster. This is what the DebugDebug
and then a local (Java) debugger is launched and connected to that port. Let’s check now that we can debug our application:
Select the browser window again, enter demo2InvokeDebugRemember my decision
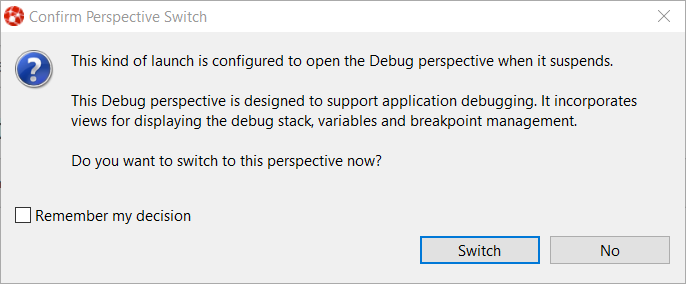
Click the SwitchDebug
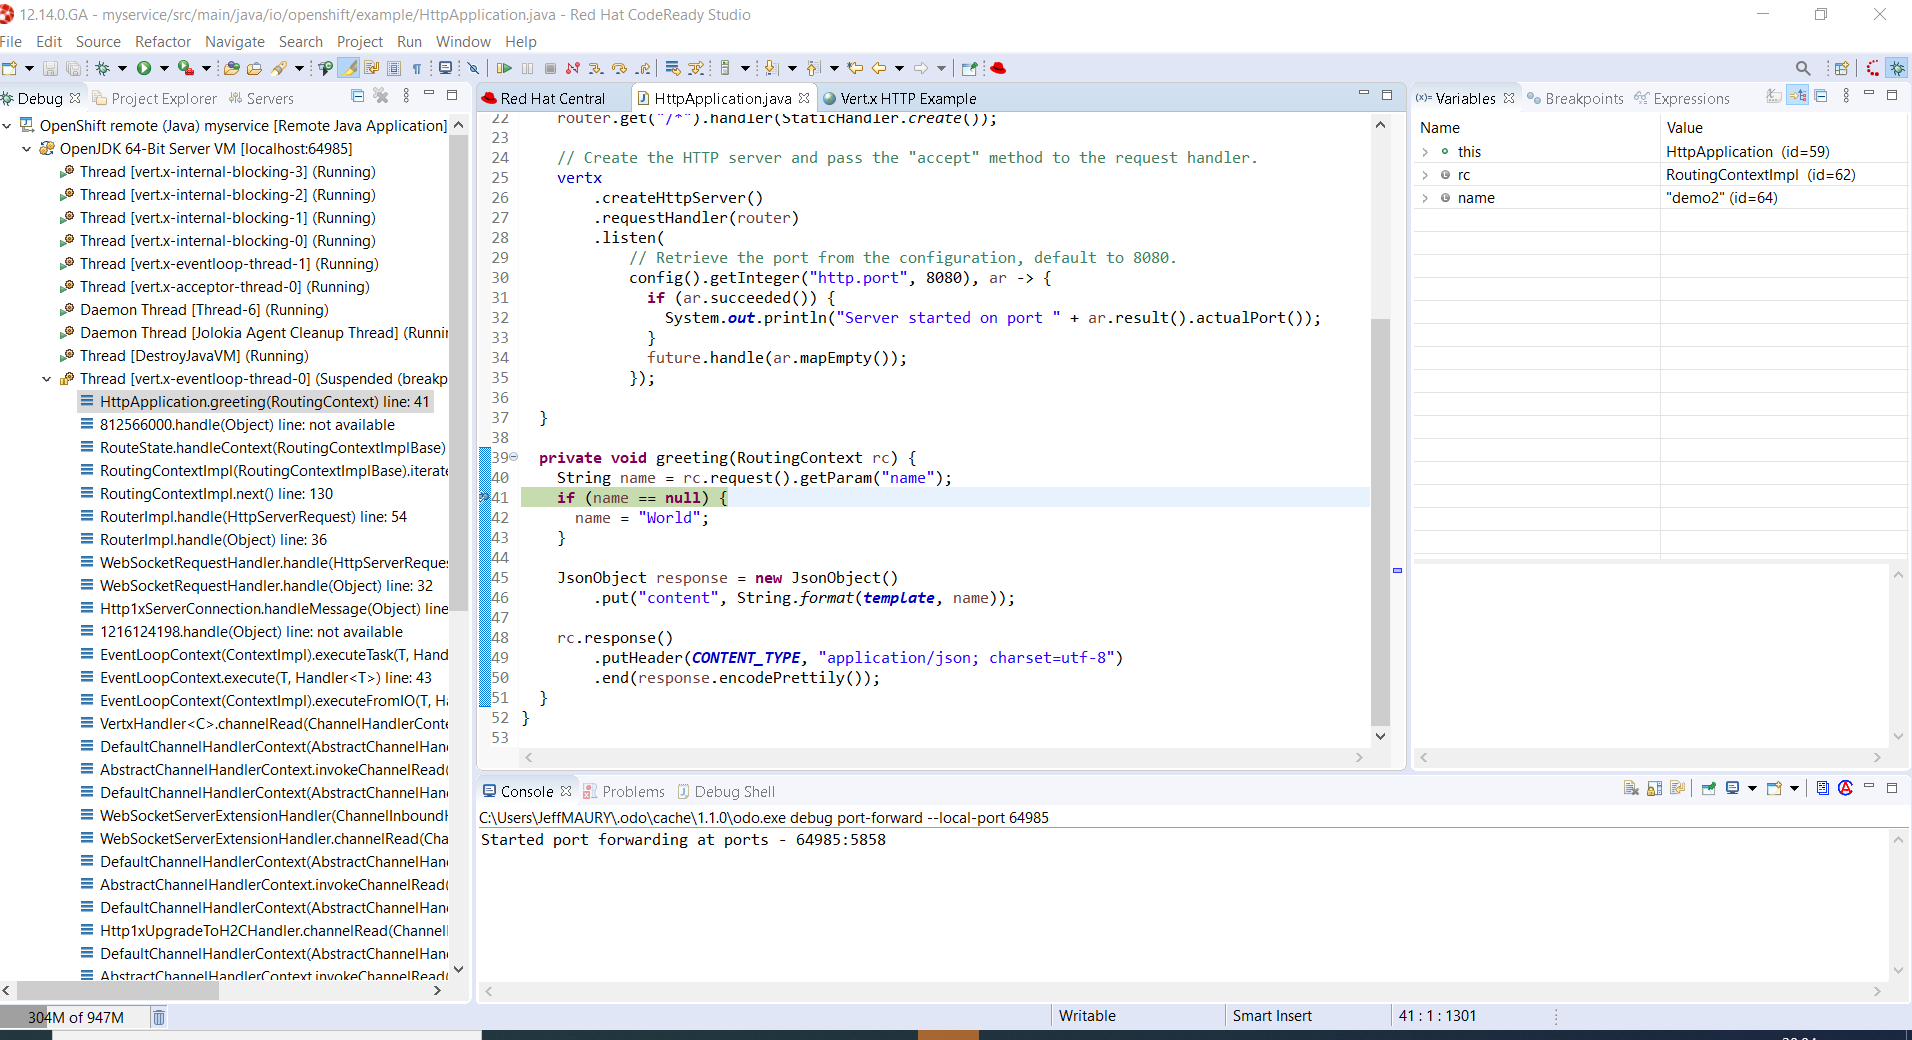
You are now debugging a Java component running on a remote cluster just like it was running locally on your workstation. Please note that we demoed this feature using a Java based component but we also support the same feature to NodeJS based components.
Related JIRA: JBIDE-27010
Related JIRA: JBIDE-27016
Server Tools
EAP 4.3 and 5.0 Server Adapters deprecated
As Red Hat JBoss Enterprise Application Server 4.3 and 5.0 are now end of life, we have
deprecate their corresponding adapters. You will see a new End of life label when
trying to create a server adapter based on those runtimes. We don’t plan any
maintenance anymore and they may be removed in the future.
Related JIRA: JBIDE-26988
Quarkus Tools
Quarkus Tools added to JBoss Tools
A new component has been added to JBoss Tools. Quarkus Tools. It aims at providing tools for Quarkus applications developers. The initial set of features is:
-
Wizard for creating Quarkus projects based on code.quarkus.io
-
Code completion and syntax validation on application.properties
-
Launching your Quarkus application in Run/Debug mode
Quarkus project creation wizard
A new wizard has been added to create a new Quarkus application project in your workspace. In order to launch it, first enter Ctrl+N to get the list of available wizards
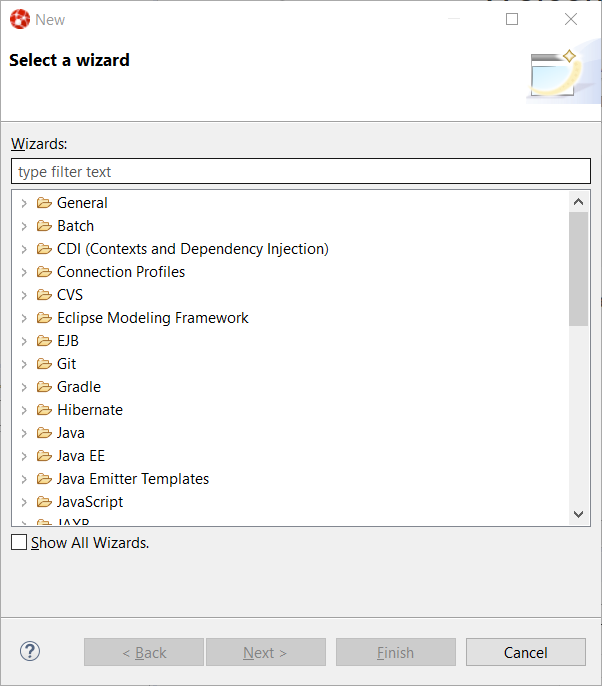
In the filter text box, enter the qu
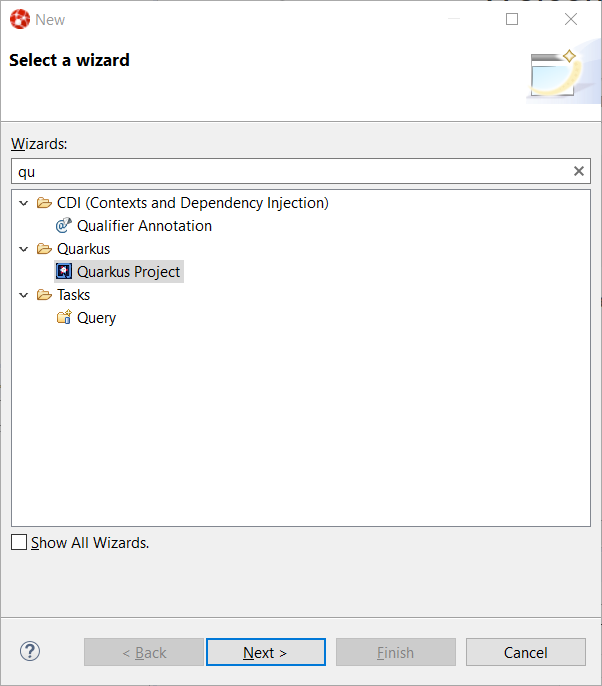
Select the Quarkus Project wizard and click the Next button:
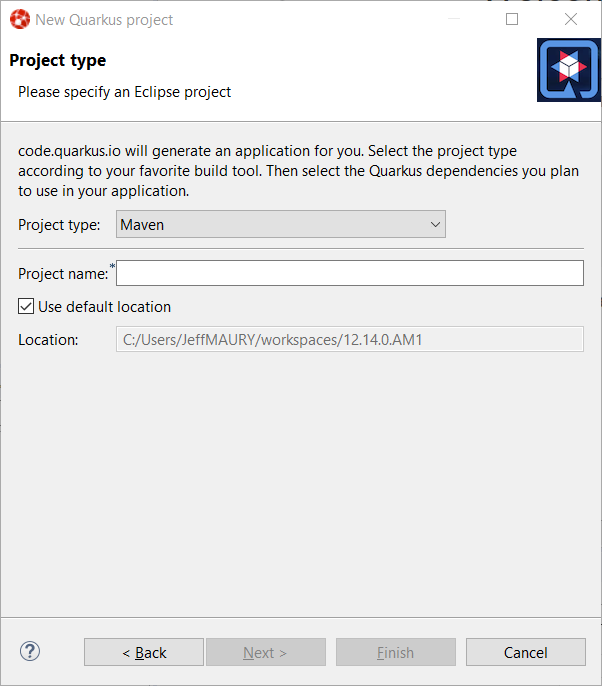
The Project type combo allows you to choose between Maven or Gradle tool used to manage your project. We’ll go with Maven for this tutorial.
Enter a project name (we will use code-with-quarkus) and click the Next button:
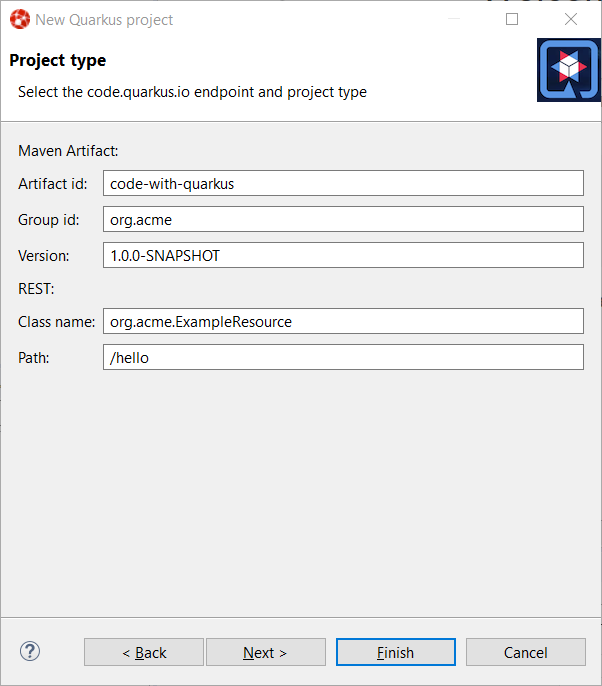
This dialog allows you to choose various parameters for you project, like the project coordinates (group id, artifact id and version) along with the base REST endpoint information. We’ll use the default so click on the Next button:
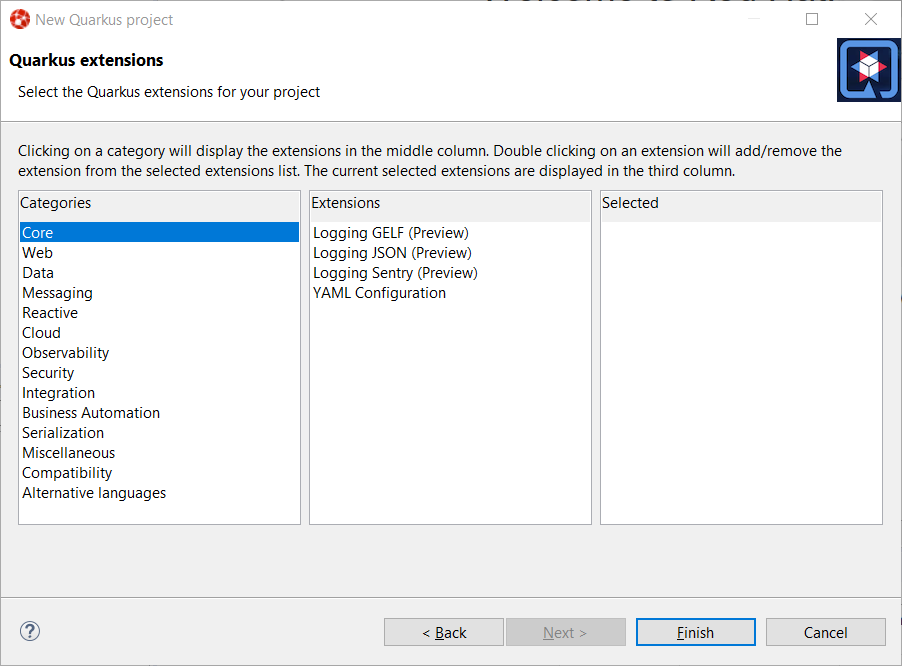
This dialog allows to select which Quarkus extensions you want to add to your project. The extensions are grouped by categories, so first select a specific category in the left table. We will choose the Web one:
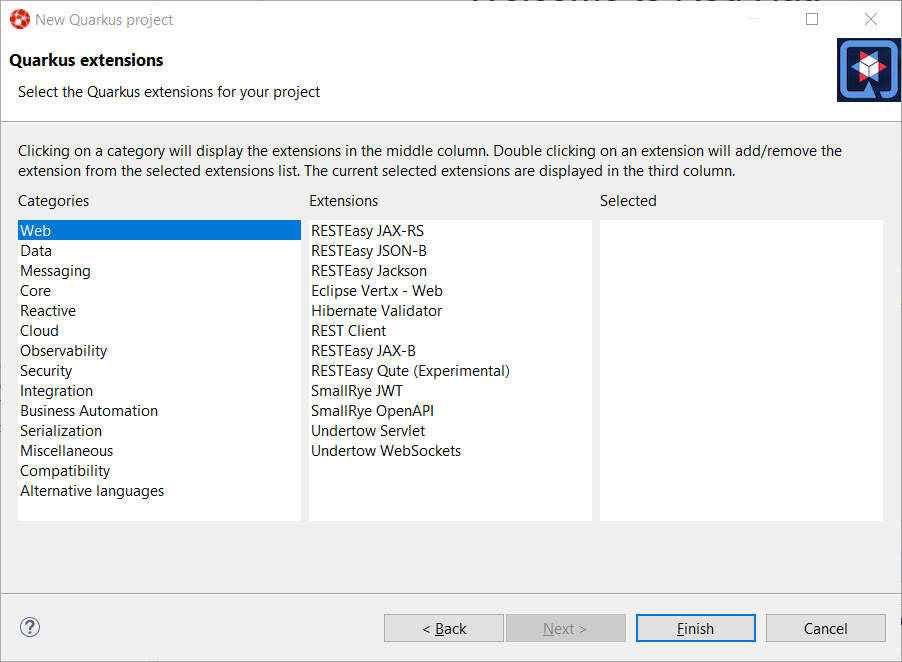
You should have noticed that the middle table has been updated. In order to add an extension, double click on the extension in the middle table. We will add RESTEasy JAX-RS and RESTEasy Qute (a templating engine):
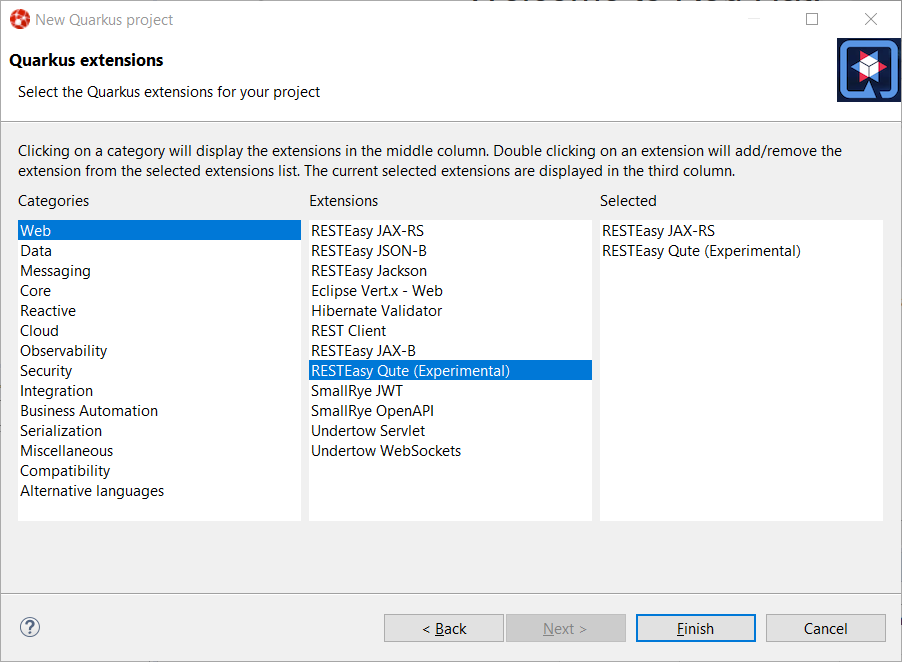
You should have noticed that the extensions that you double clicked on are now being added to the right table. If you want to remove an extension from the list of selected ones, double click again either in the center table or in the right table.
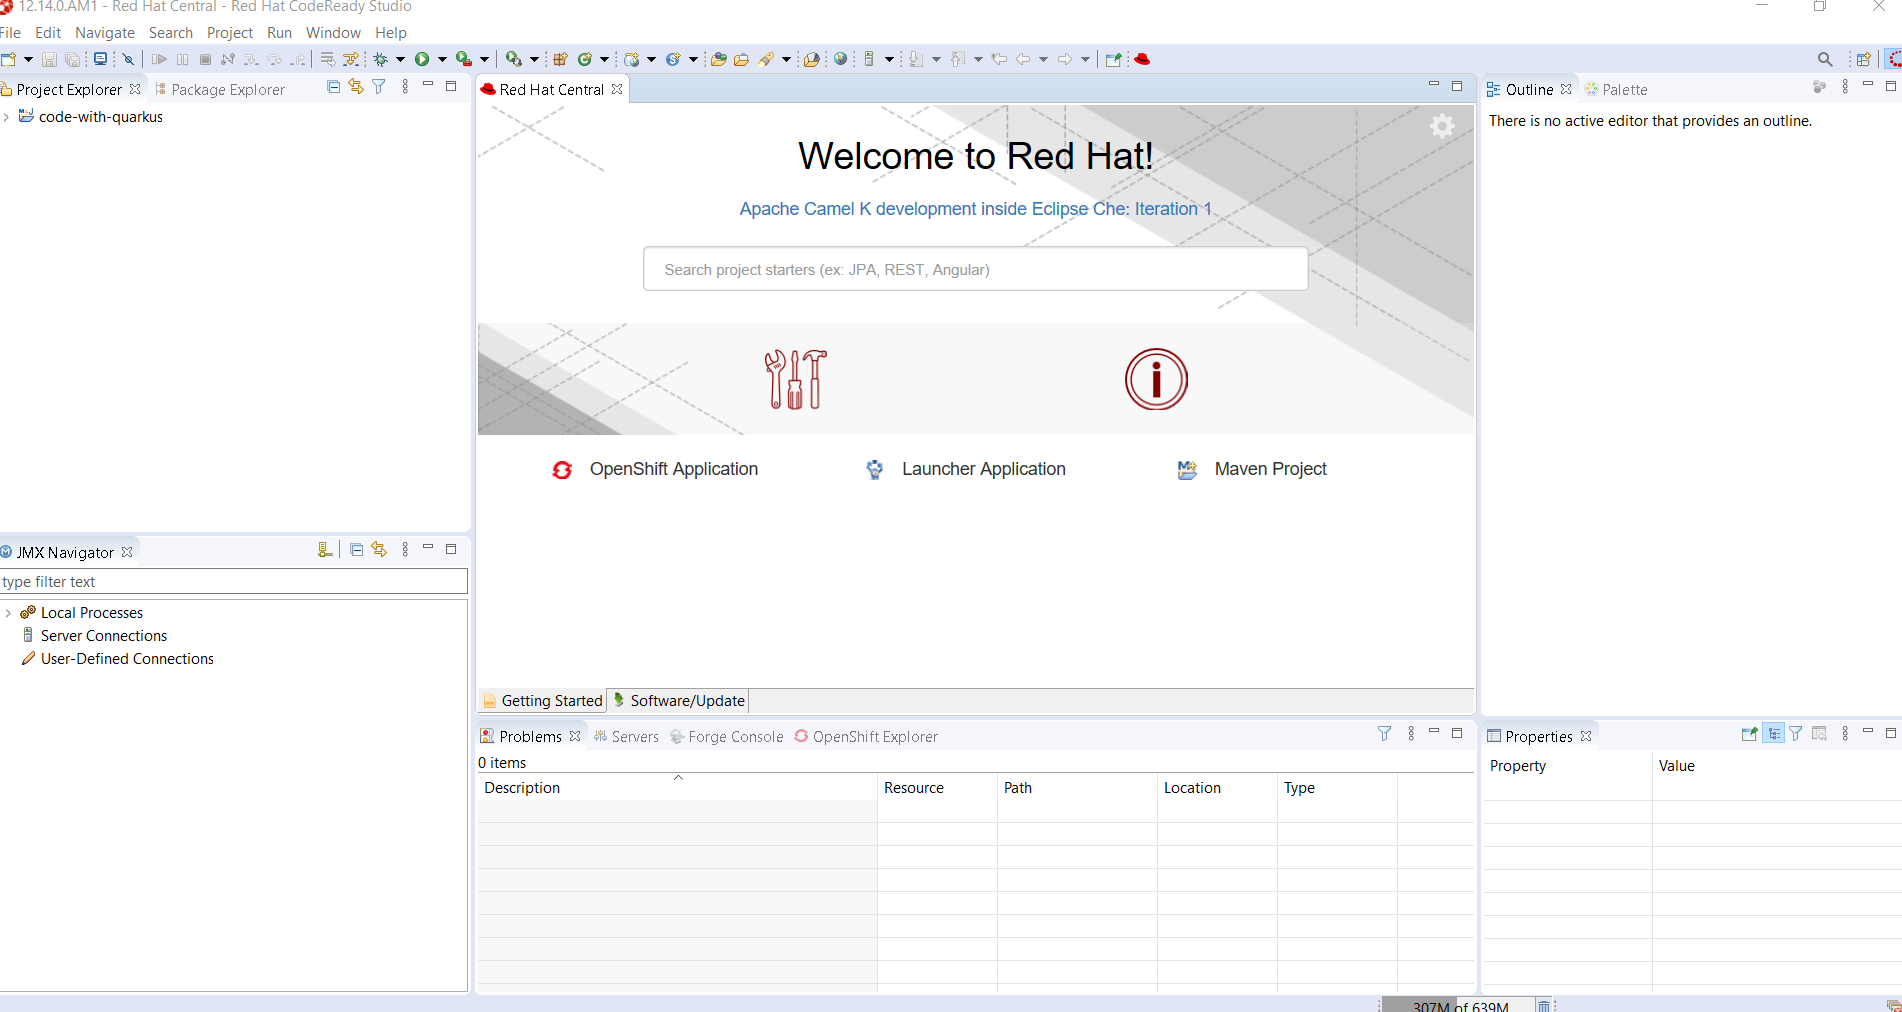
We are now all set so click on the Finish button to launch the project creation. The project creation job is then launched, dependencies are being retrieved and after a while, the new project will appear in the Project Explorer window:
We have successfully created our first Quarkus project. Let’s see now how we can launch this application and debug it.
Running the Quarkus application
Running a Quarkus application can be done from the workbench Run configurations. Select the Run → Run Configurations… menu to display the dialog allowing to create a Run configuration.
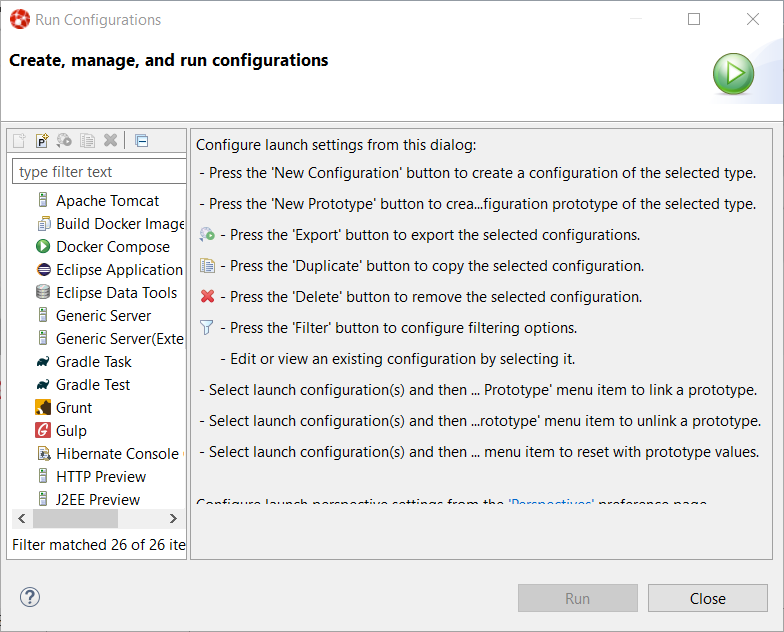
Scroll down until the Quarkus Application is visible and select it:
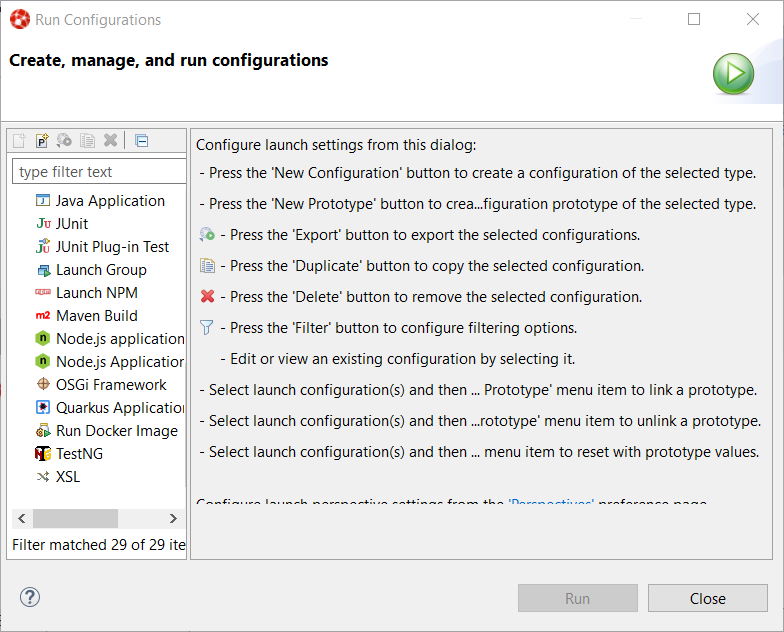
Click on the New configuration button (top left):
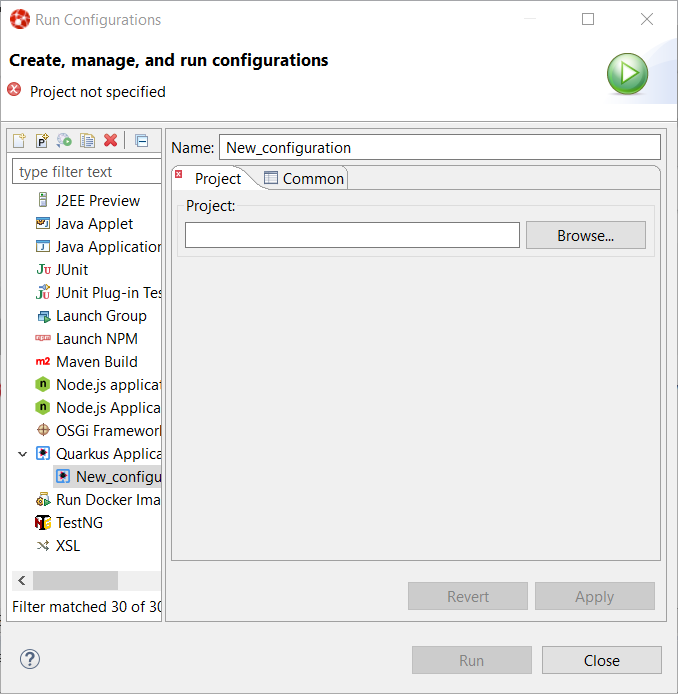
A workspace project needs to be associated with the configuration so click on the Browse button to see the project selection dialog:
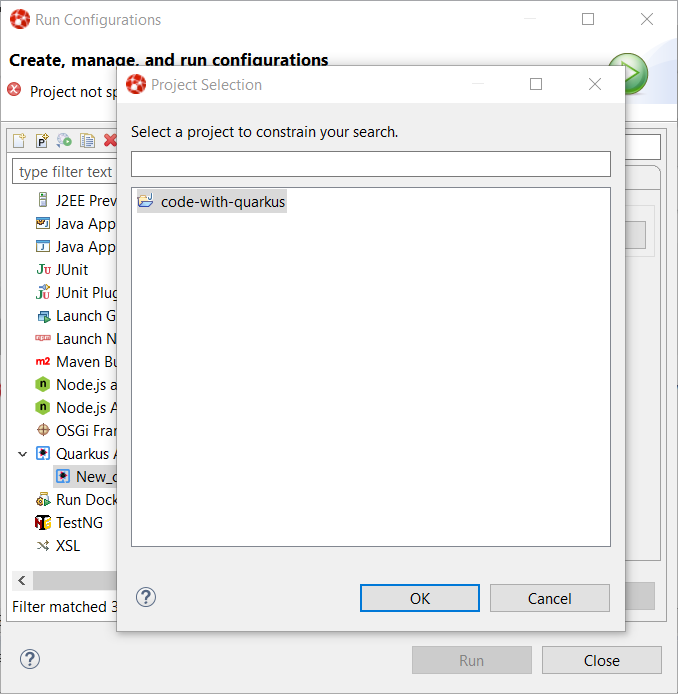
As the workspace contains a single project, it is automatically selected and we can click on the OK button:
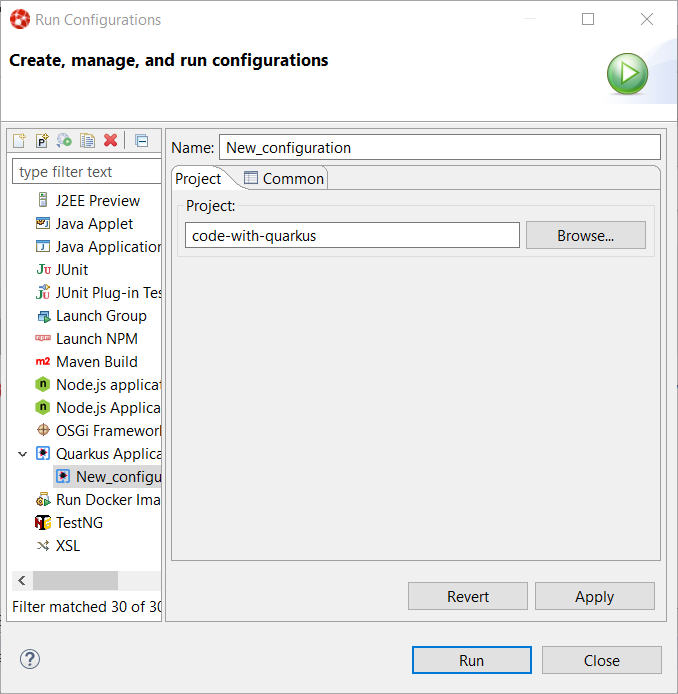
The configuration is now ready to be used. So let’s start our Quarkus application by clicking on the Run button:
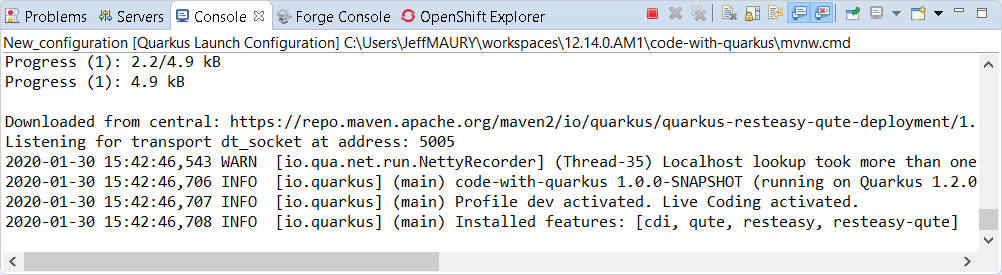
You should see a new Console being displayed.
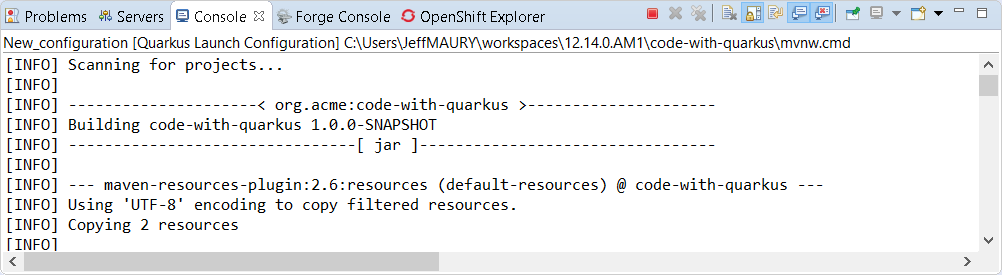
The application is being built and after a while, it will be started:
Debugging the Quarkus application
Debugging a Quarkus application is just a simple as launching the previous configuration we’ve just created in Debug. You just need to open the Run → Debug Configurations…. menu and click on the Debug button.
It will start the Quarkus application like in the previous paragraph but also connect a remote JVM debug configuration to your running Quarkus application. So if you have set breakpoints in your application source files, the execution will automatically stops there.
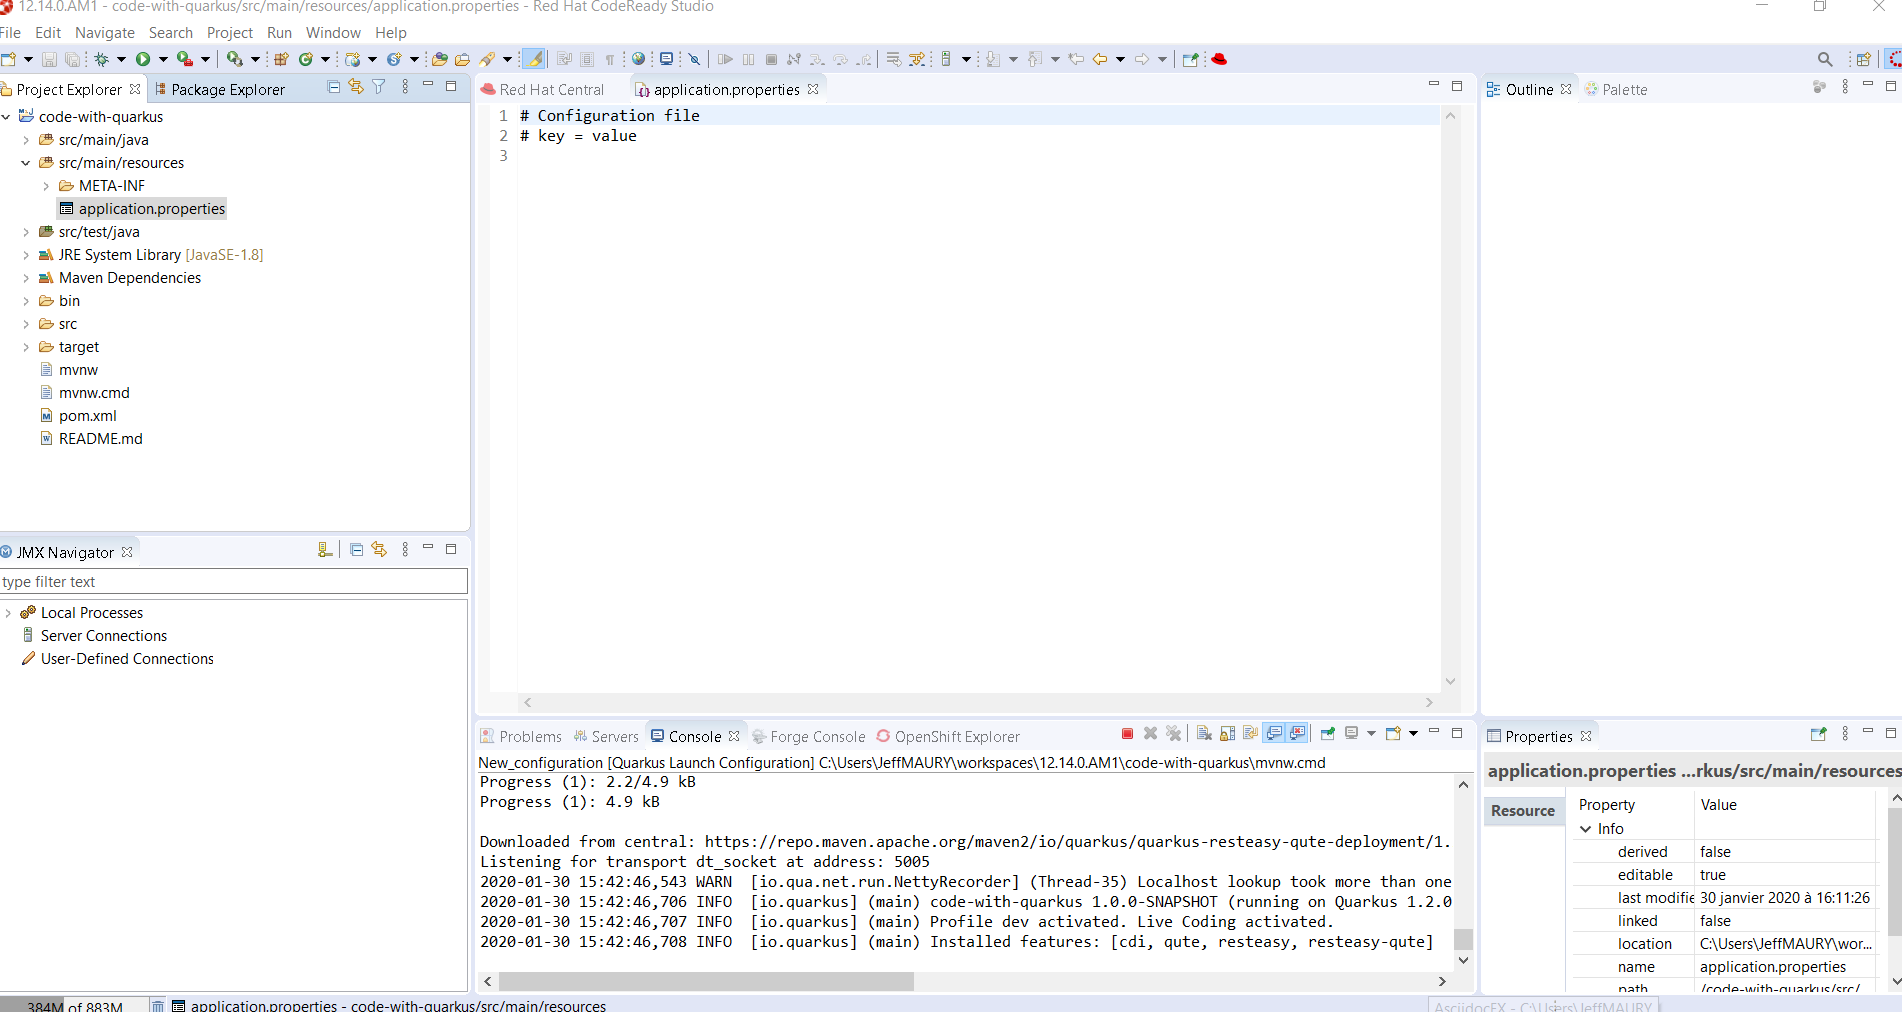
application.properties content assist
Every Quarkus application is configured through a configuration called application.properties.
The content of this configuration file is dependent of the set of Quarkus extensions that your application is using. Some settings are mandatory, some others are not and the possible values are specific to the nature of the setting: boolean, integer, limited set of values (enumerations).
So, as a developer, you need to look at various guides and documentations (the core Quarkus and the extension specific ones)
So Quarkus Tools provides content assist on those specific files that:
-
validates the content of the application.properties files
-
provides you with the possible setting names and values
Let’s see it in action.
Go to src/main/resources/application.properties in the project and right click and select Open With → Generic Text Editor:
Go the third line of the file and invoke code completion (Ctrl + Space):
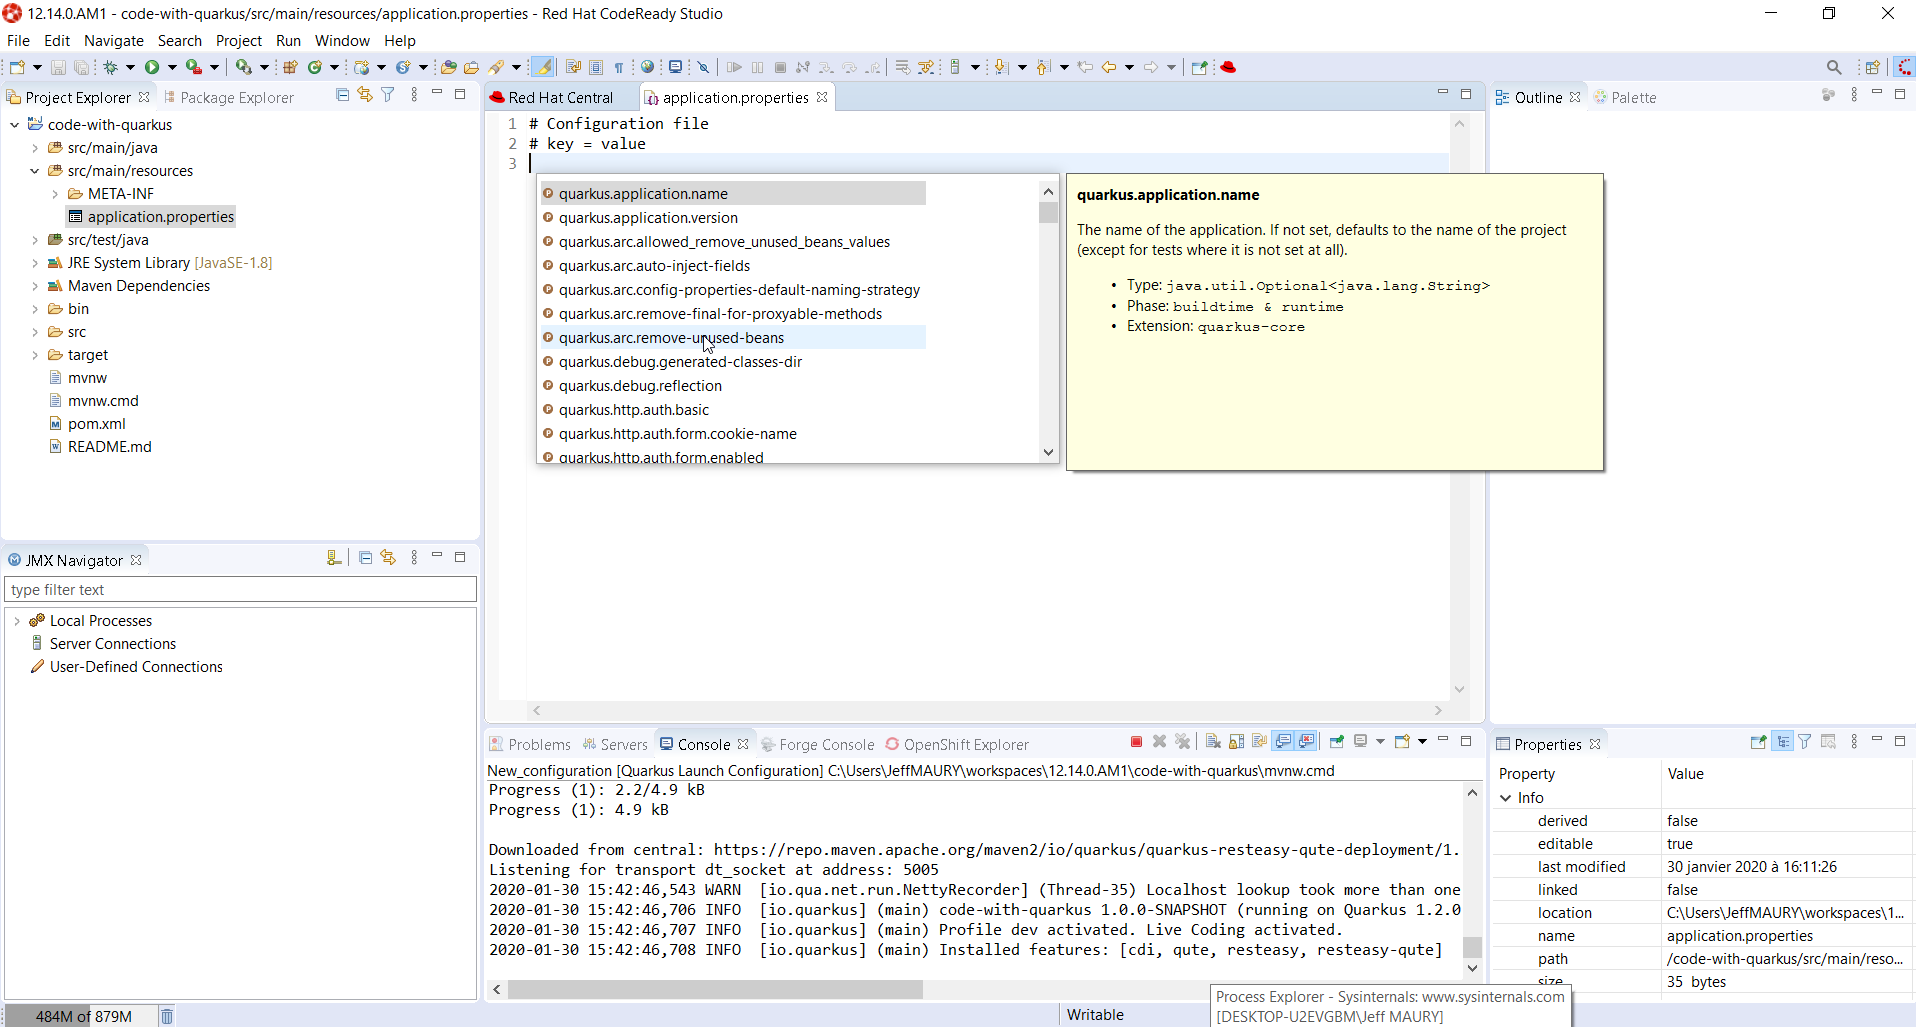
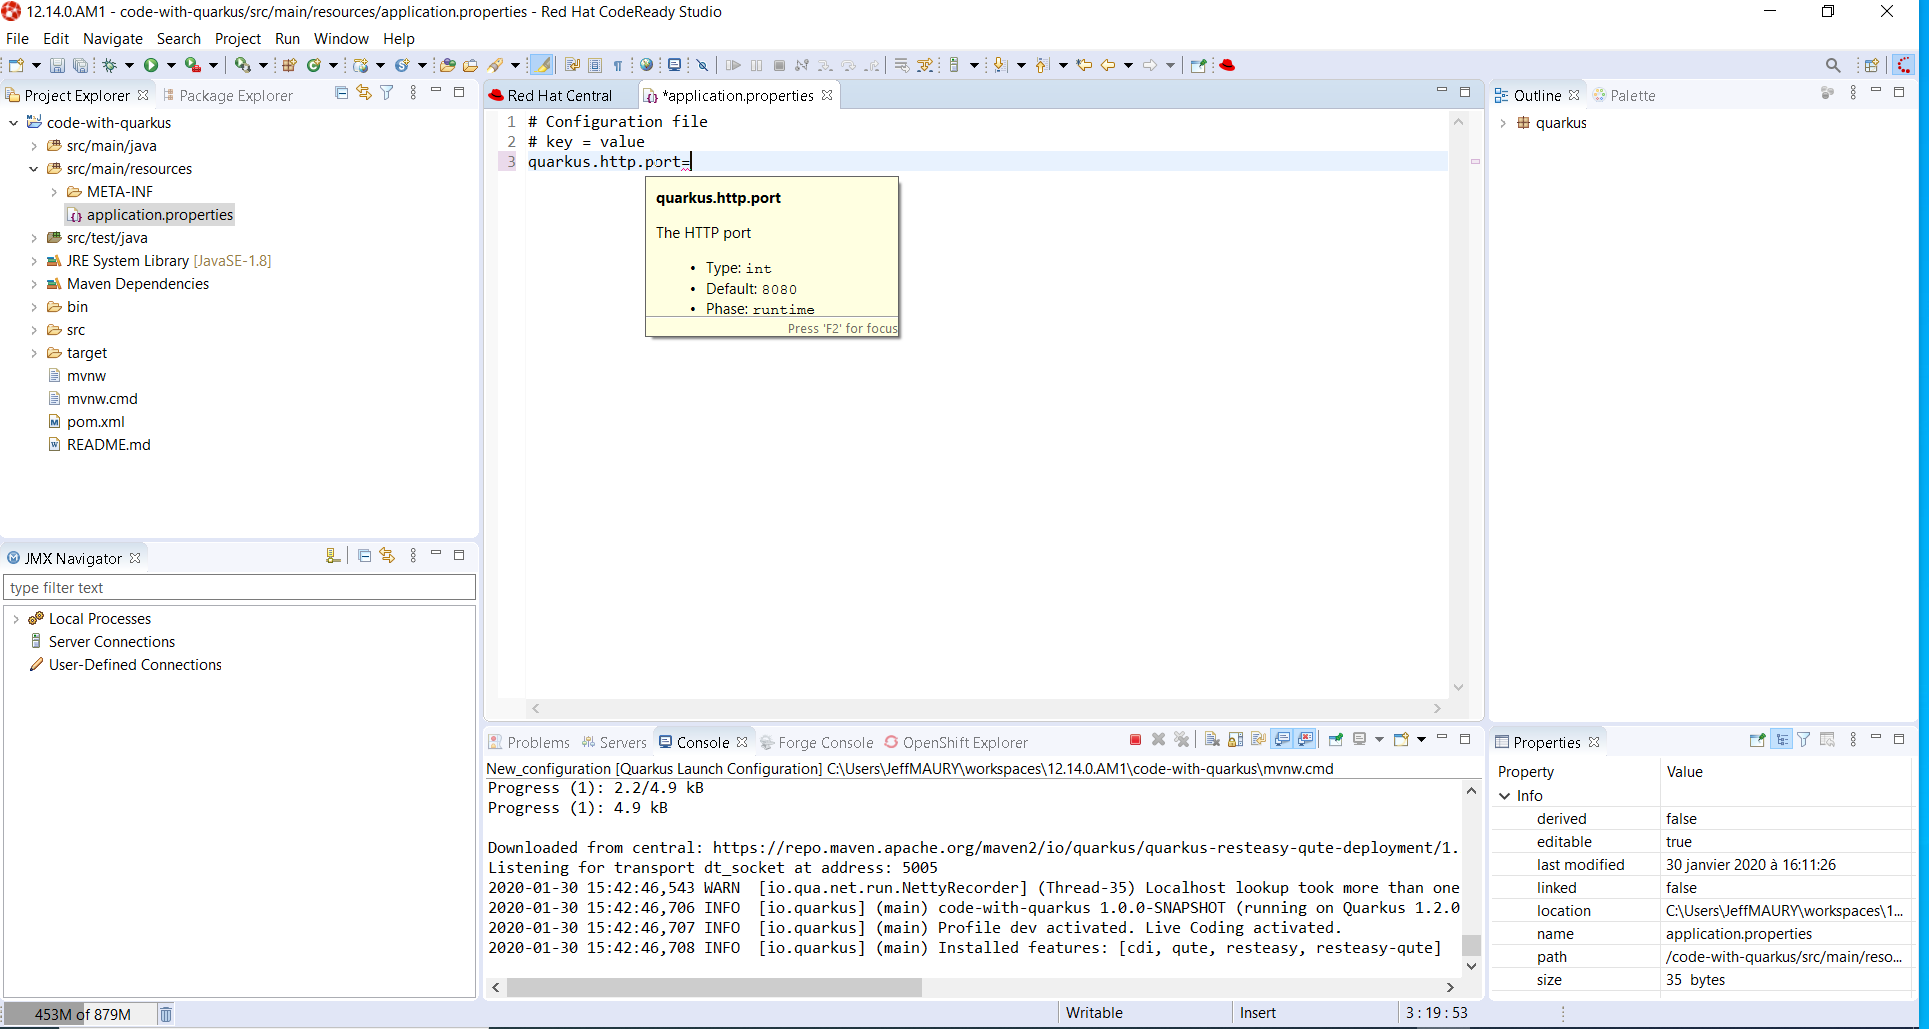
For each setting, a documentation is displayed when you mouse over the setting. Let try to add quarkus.http.port to the file and mouse over this name:
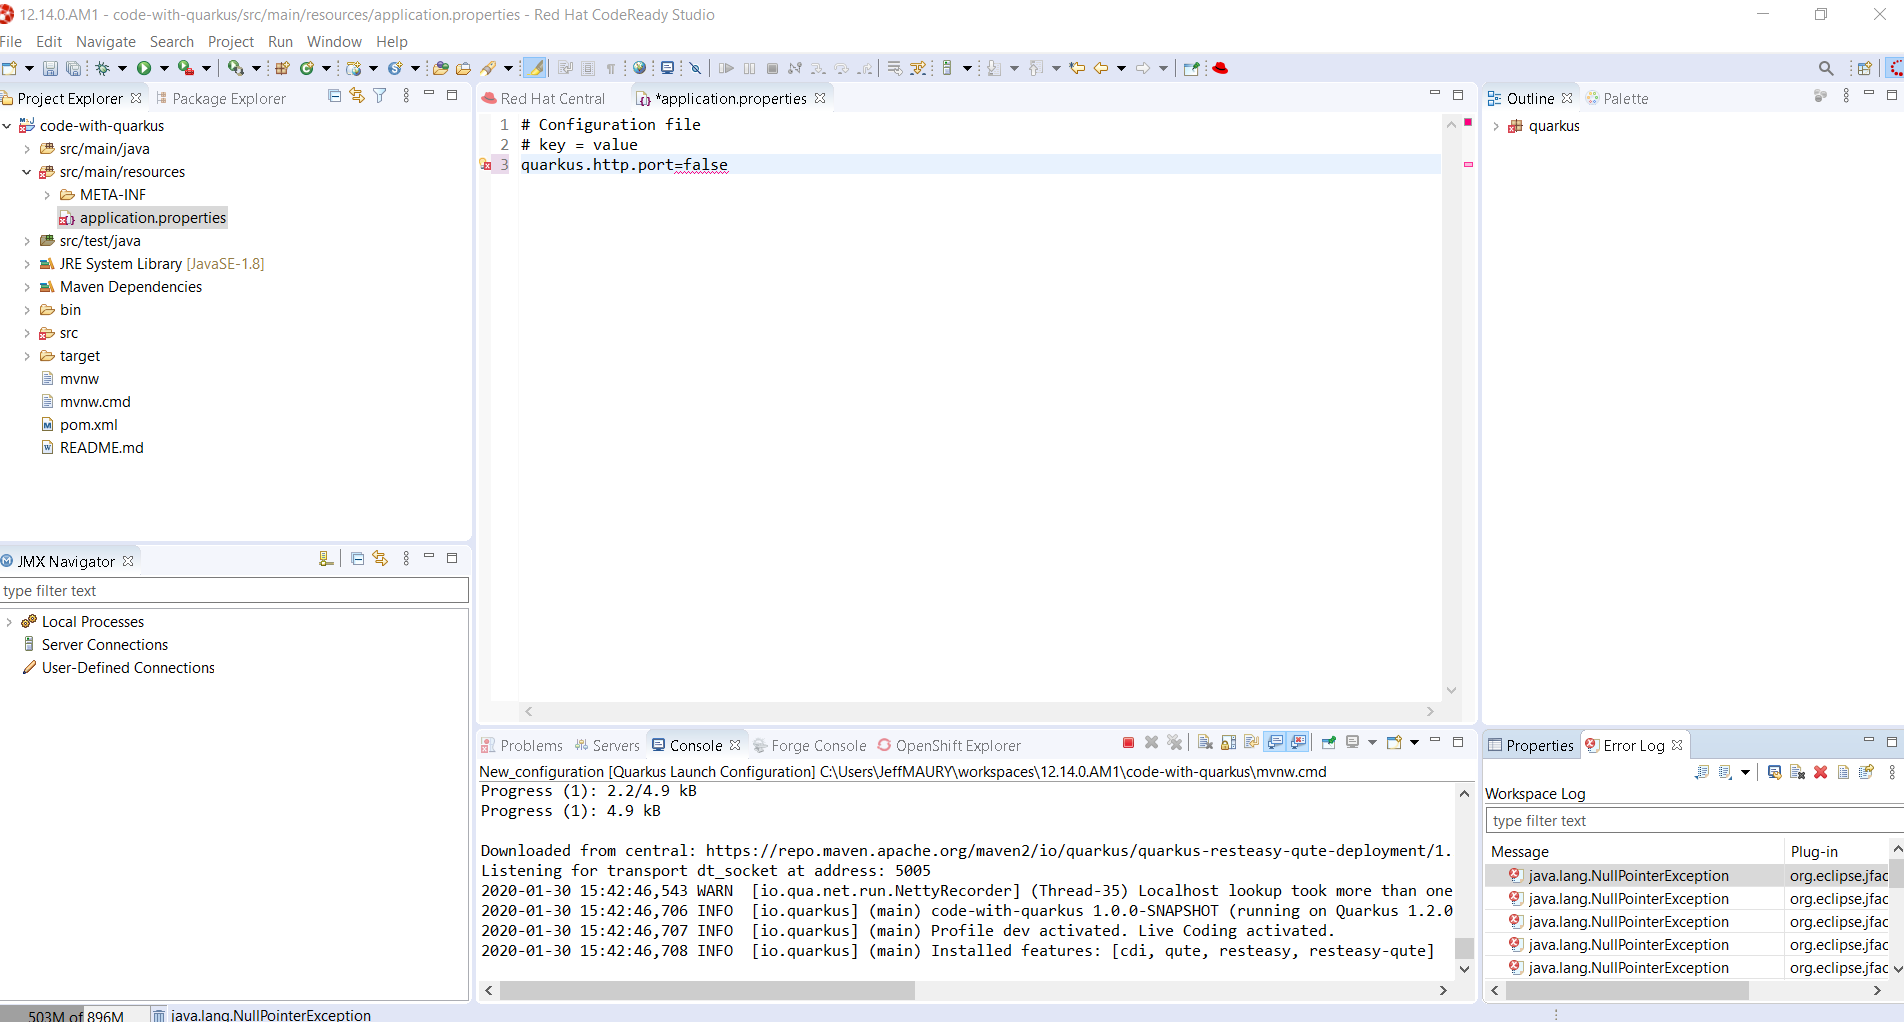
If we enter a wrong value (false instead of a numeric value), then the error will be highlighted:
This is the first set of features that will be integration into the next version of JBoss Tools. We encourage you to used it and if you are missing features and/or enhancements, don’t hesitate to report them here: JBoss Tools issue tracker
Related JIRA: JBIDE-26978