A JBoss Project
Red Hat

Posts tagged with 'jbosscentral'

When you have have typed collections in your code like:

public void process(List<Product> products) {
  List<Customer> customers = getCustomers();
  // cursor here
}

Most know that you can use the foreach template via normal content assist to quickly generate code like this:

public void process(List<Product> products) {
  List<Customer> customers = getCustomers();
  for(Customer c : customers) {
    // cursor here
  }
}

But the foreach template will always choose the nearest collection, making it impossible to use with for example the products parameter in the above example.

The solution is to use the 'enhanced for loop' Quick Fix.

It is available when you have type the name of the collection and use the Ctrl+1 (Cmd+1 if on OS X) shortcut.

To illustrate it, here is a small video of it in Eclipse.

Hope you enjoyed this little tip!

Thanks to Xavier Coulon for asking the question and giving the idea for this Tip blog, and thanks to Markus Keller (JDT UI lead) for reminding me about the Quick Fix solution.

Have fun,
Max Rydahl Andersen
@maxandersen

I previously decribed how to use a combination of maven-war-plugin webresources and Maven profiles, in order to deploy minified resources. In this article, we’ll expand on these concepts a bit, to demonstrate how to deploy test resources, in a somewhat elegant and portable way.

User story

In some cases, you want your web application to deploy test resources, whether it’s logging or database configuration files, or even some test mocks during development.

When you’re using Eclipse Java EE, m2e-wtp explicitely prevents test resources from being deployed (in order to limit behavior discrepancies between Maven CLI and Eclipse), and if you try to mess with Eclipse’s Deployment Assembly page, its settings will be reset next time you perform a Maven > Update projet configuration.

So you need a solution that works for both Eclipse, command line and even other IDEs as well. Let’s see how you can achieve that…​

Pre-requisites

You only need :

  1. a Java EE based Eclipse distribution for the following to work: stock Eclipse, JBoss Developer Studio or SpringSource Tools Suite for instance, as long as m2e-wtp is installed with it.

  2. a Maven project with packaging war

Configure a new dev profile

In order to deploy test resources with WTP, we need to add a new Maven dev profile to the <profiles> section of your pom.xml. This can easily be done with Ctrl+space assist. Selecting the m2e profile template and changing the id to dev will get you started.

The profile is automatically enabled when running in m2e, via the m2e.version property.

Then, you need to add a maven-war-plugin configuration to the <build><plugins> section of the new profile, and configure <webResources> so that test resources from the test output directory are copied to WEB-INF/classes, using a regexp to only include specific files.

Eventually, this is how your dev profile should look :

<profile>
  <id>dev</id>
  <activation>
    <property> <!-- this will automatically be enabled when using m2e -->
    <name>m2e.version</name>
    </property>
  </activation>
  <build>
    <plugins>
    ...
      <plugin>
        <artifactId>maven-war-plugin</artifactId>
        <!-- this will inherit existing maven-war-plugin configuration-->
        <configuration>
          <webResources>
            <resource>
              <directory>${project.build.testOutputDirectory}</directory>
              <includes>
                <include>**/some/test/resources/**</include>
              </includes>
              <targetPath>WEB-INF/classes/</targetPath>
            </resource>
          </webResources>
        </configuration>
      </plugin>
    </plugins>
  </build>
</profile>

In Eclipse, the matching test resources are not served directly but are actually copied/processed to target/m2e-wtp/web-resources/WEB-INF/classes and deployed from there.

If the original configuration already defines <webResources>, use <webResources combine.children="append"> in the dev profile, so all resources get deployed. You can learn more about merging plugin configuration on the Sonatype blog.

If you decide to declare this profile in a parent pom, don’t forget to put the <plugins> node under the <pluginManagement> section, or else, these configurations will not be inherited by your war projects.

This extra configuration will be merged to your existing maven-war-plugin configuration (check the maven-war-plugin configuration in the Effective POM tab of the pom.xml editor).

Now, using m2e-wtp, every time a test resource is modified, it will automatically be deployed to your server, on-the-fly. This is borderline magic, I know.

Conclusion

Hopefully, this article gave you a glimpse of the powerful Maven capabilities m2e-wtp brings to Eclipse, showing how you can easily deploy your test resources in your development environment in a portable way.

Take it easy!

We are working on our plans for JBoss Tools and Eclipse in 2015 and got some high level topics we are looking into working on and was wondering what you would like to see improved.

Overall features

The overall features we are currently planning to work on in 2015 for our core tools (excluding Integration stack plugins) is listed below at a high level.

  • (Hybrid) Mobile Tooling

  • HTML5/JavaScript/AngularJS

  • Making Eclipse Better

  • Docker/Vagrant

  • JBoss Modules support

  • Java EE 7 (Server, Batch, Web Services, JAX-RS, etc.)

  • OpenShift 3 (kubernetes)

  • Persistence tools (hibernate, JPA, querying, etc.)

Make your voice heard

You can make your voice heard by going to http://twtsurvey.com/jbosstools2015 and answer the 2 simple questions!

…​and we do have a 'Other' field where you can let us know if we forgot something above ? :)

Thanks for your input!

Have fun!
Max Rydahl Andersen
@maxandersen

JavaScript is extremely popular nowadays and the fact Eclipse JavaScript Development Tools supports JavaScript ECMA3 standard only didn’t let us sleep well, so we decided to do something about it.

First we got to work and fixed tons of issues in Eclipse JavaScript Development Tools to make it usable, then when it esd good enough we extended it with some good features to make it even better.

Tern.java Adapter for JavaScript Facet

Tern.java is now working behind the scene to provide JavaScript code analysis and content assist. Good news there is no need to configure it manually. Just install Tern.java Adapter from JBoss Tools update site and it configures projects with JavaScript facet automatically to unleash all Tern IDE features for you.

ECMA5 Support

HTML and JavaScript source editors now show JavaScript ECMA5 proposals in content assist for projects with JavaScript facet.

javascript content assist

You can also get content assist for many popular JavaScript Libraries through Tern Modules. Manual configuration is required in Project Preferences.

javascript modules

CordovaJS Module for Tern.java

We provided CordovaJS Module for Tern to improve Cordova related content assist in JavaScript source. Tern integration configure it for Eclipse Thym Project automatically, so you don’t need to do manual configuration to see content assist for CordovaJS. Just create Thym project, open index.htm and start using it.

javascript cordova content assist

AngularJS Tools Early Access

JBoss Tools provides support for AngularJS through JBoss Tools Central Early Access. It installs full distribution of AngularJS IDE with many cool feature like:

  • source code highlighting and navigation

  • source code content assist

  • AngularJS model view

  • and more.

Read about all AngularJS IDE features here.

/Denis Golovin

The JBoss Developer Studio 8 and JBoss Tools 4.2 release enables developers to use these tools to build mobile applications by using the Apache Cordova framework. Apache Cordova (fka, PhongeGap) is a framework for building packaged mobile applications using web technologies such as HTML5, JavaScript and CSS3. In this article, I will explore different scenarios for getting started with the tools and Apache Cordova.

Where are the tools?

Hybrid mobile tools are not part of the default installation but getting them is easy. Although there are other ways, I usually use JBoss Central to pull them in. Here is how.

First switch to Software/Update tab on JBoss Central. Next select JBoss Hybrid Mobile Tools + CordovaSim. I usually select the AngularJS for Web Tools option before hitting the Install/Update, in order to get the improved support for Ionic framework.

Here is a screeen cast for getting started with the hybrid mobile tools.

1. Start a new Cordova project

This is the option when starting a new project or just experimenting with Apache Cordova development.It gives a basic project template that you can easily change and you can select the initial set of cordova plug-ins to include into your project. I usually add the console plugin at this time, to be able to use console.log() during development and remove it before the final export.

The video above not only shows how a project is created but also introduces the tools at your disposal going forward.

2. Import your existing Cordova application

If your Cordova application already exists and it was developed using a compatible tool such as Cordova CLI, you can import it easily and start using all the functionality available. Import process will also restore your plugins if you have been using the new cordova save command.

Here is a short video that shows the import feature in action.

3. Use existing mobile web site code

Often getting started with your packaged mobile application requires sharing the assets with a web application. We do support linking of resources from different locations to create a Cordova based mobile application. Although I do not recommend using artifacts, let alone whole web sites, that were created for desktop to be turned to mobile applications, but it helps to know that your tools are capable when it gets desperate.

While JBoss Forge has been included in JBoss Tools and Developer Studio for a while now, the recent JBoss Tools 4.2 and Devloper Studio 8.0 releases contain support for Forge 2.12.1. Forge has now become a mature component inside JBoss Tools and Developer Studio with a plethora of available commands that can be executed either using the convenient wizard style or using the integrated Forge console.

Wise Wizards

To use the wizards, you need to issue the Ctrl+4 key combination (or Cmd+4 on a Mac). It will bring up a popup containing all the commands that are available in the currently selected context.

forge command popup

If this key combination does not work, chances are high that you are using a keyboard layout such as AZERTY. Don’t panic, in this case it is just a matter of redefining the key combination to something that works on your hardware. Use the Eclipse preferences dialog (Window→Preferences or something similar) to do this.

forge keys prefs

Selecting the 'Project: new' entry of the popup will open the Forge wizard that allows you to create a new project.

forge project new wizard

Core Console

If you are a console afficionado and typing and code completion is more your thing, you can use the integrated Forge console. One way to bring up the console is to type 'Forge Console' in the 'Quick Access' text field in the toolbar of your Eclipse workbench and then select the 'Forge Console' entry that is visible in the popup.

forge quick access

Another way would be to select 'Window→Show View→Forge Console' from the main menu bar. This will only be possible when you are using the 'JBoss' perspective. In another perspective, you can use 'Window→Show View→Other…​' and then navigate to the 'Forge→Forge Console' entry.

forge show view

In the console you can type Forge commands to perform the same tasks as if you were using the wizard-style approach.

forge project new console

Chatty Cheatsheet

If you are new to Forge, this new feature will certainly help you on the way. And as a bonus it will also help you with learning to develop an HTML5 application with REST, CDI and AngularJS. You can open this brand new cheatsheet by importing the 'AngularJS Forge' example from the 'JBoss Central' page.

forge angularjs central

In case the 'JBoss Central' page is not open or you inadvertently closed it, no worries. You can always bring it back by clicking the 'JBoss Central' icon in your Eclipse toolbar.

forge jboss central

After clicking the 'AngularJS Forge' example hyperlink, a wizard will guide you through the import process. Just accept all the defaults. When the wizard is done, a popup will ask you if you want to open the cheatsheet.

forge angularjs import

Make sure you keep the open option checked when you click the 'Finish' button. Now the cheatsheet will reveal itself in all its glory.

forge angularjs cheatsheet

There is no point in repeating here all the information that is available in the cheatsheet but in short, it will provide you with some general information and then guide you through the development, deployment and execution of a HTML5 application. You will see different examples of using Forge commands such as REST endpoint generation and scaffolding an AngularJS user interface. Check it out!

Happy Forging,
Koen Aers
@koentsje

Burr Sutter recently recorded and uploaded a handful of screencasts on Hybrid Mobile Development Tools that we recently shipped in JBoss Tools 4.2.0.Final and JBoss Developer Studio 8.0.0.Final.

Those videos (totalling more than 1h15 of materials!) cover the following topics:

Sit back, grab your headphones and enjoy ;-)

Xavier
@xcoulon

In JBoss Tools and JBoss Developer Studio, we’re continuously working to augment the Maven integration experience in Eclipse. Some of the features we’ve been playing with, if deemed successful, will eventually be contributed back to m2e, like the Maven Profile Management UI. Others, more centered around JBoss technologies, will stay under the JBoss Tools umbrella.

JBoss Tools 4.2 and Developer Studio 8, based on Eclipse Luna, take advantage of all the nice improvements made to m2e 1.5.0 and then, add some more :

m2eclipse-egit integration

The Import > Checkout Maven Projects from SCM wizard doesn’t have any SCM provider by default, which can be pretty frustrating at times. With Git becoming the new de facto source control system, it only made sense to make m2eclipse-egit the sensible default SCM provider for m2e.

m2eclipse-egit will now be automatically installed when a JBoss Maven integration feature is installed from the JBoss Tools update site.

It is installed by default with JBoss Developer Studio 8.0.0 as well.

Maven Central Archetype catalog

Since m2e 1.5.0 no longer downloads Nexus Indexes by default, a very small, outdated subset of Maven Archetypes is available out of the box.

To mitigate that, the JBoss Tools Maven integration feature now registers by default the Maven Central Archetype catalog, providing more than 9600 archetypes to chose from, when creating a new Maven project. Accessing the complete list of archetypes is even way, waayyyy faster (a couple seconds) than relying on the old Nexus index download.

maven central catalog

Pom properties-controlled project configurators

JBoss project configurators for m2e now support an activation property in the <properties> section of pom.xml. Expected values are true/false and override the workspace-wide preferences found under Preferences > JBoss Tools > JBoss Maven Integration.

Available properties are :

  • <m2e.cdi.activation>true</m2e.cdi.activation> for the CDI Project configurator,

  • <m2e.seam.activation>true</m2e.seam.activation> for the Seam Project configurator,

  • <m2e.hibernate.activation>true</m2e.hibernate.activation> for the Hibernate Project configurator,

  • <m2e.portlet.activation>true</m2e.portlet.activation> for the Portlet Project configurator.

The pom.xml editor also provides matching XML templates for these properties, when doing ctrl+space in the <properties> section.

Maven Repository wizard improvements

The Configure Maven Repositories wizard, available under Preferences > Jboss Tools > JBoss Maven Integration saw a couple improvements as well :

Advanced options for maven repositories

You can now choose the repository layout, enable/disable snapshots or releases, and change the update policy in the advanced section :

maven repository advanced

Automatically identify local Maven repositories

When adding a new Maven repository, you can scan for JBoss Maven repositories unzipped locally, with the Recognize JBoss Maven Enterprise Repositories…​ button, in order to automatically add it to your .m2/settings.xml.

recognize maven repo

The identification process now looks for a .maven-repository file at the root of the folder you selected. This file follows the .properties file format and is expected to contain up to 3 attributes :

  • repository-id : the repository id

  • name : a (descriptive) repository name. Optional, defaults to repository-id

  • profile-id : the profile id the repository will be activated from. Optional, defaults to repository-id

As a concrete example, the JBoss Mobile repository .maven-repository file would contain :

repository-id=local-jboss-mobile
name=JBoss Mobile Maven Repository
profile-id=local-jboss-mobile

What’s next?

Tired of seeing these "Project configuration is out-of-date" errors whenever you tweak your pom.xml? We’re currently playing with a plugin that will automatically do the Maven > Update project configuration for you. You can try a very alpha version from the following p2 repository : http://download.jboss.org/jbosstools/builds/staging/jbosstools-playground_master/all/repo/. Let us know if/how it works for you, so we can decide what to do next with it.

Enjoy and see you soon!

Fred Bricon
@fbricon

This post introduces the new service debugger for JBoss SwitchYard and provides the reader with an overview of SwitchYard’s capabilities, as demonstrated in its example “quickstart” programs.

To install this feature in Developer Studio 8 and JBoss Tools 4.2 you should enable 'Early Access' in Central and install the 'JBoss Integration and SOA Development' connector. See more in the Integration Stack Beta release blog.

Introduction

One of the most useful (and by the way, also one of the coolest) features of JBoss SwitchYard (http://switchyard.jboss.org/) is its graphical process editor. The editor enables you to create composite service definitions through a graphical interface, instead of having to directly edit cumbersome raw XML. For example:

debugger 1

The big blue box in the center window is called the canvas. Here’s where you can see the graphical representation of the service definition. With SwitchYard, it’s all about the services. With the SwitchYard editor, you can create the services, and not just edit Java source code.

What’s always been missing has been a corresponding tool for debugging SwitchYard Services. This gap is now being filled by the SwitchYard Debugger.

The SwitchYard Debugger

A debugger such as GDB provides you with the ability to interrupt a program’s execution through breakpoints so that you can examine code and data. In SwitchYard, however, you’re not just dealing with Java classes, you 're creating (and debugging) services. The SwitchYard debugger lets you add a breakpoint to any service or reference to a service. The debugger supports these actions:

  • Breakpoints can be configured to stop at various points in the execution chain, including service entry or transaction setup (entry, teardown, fault).

  • If you add a breakpoint on a service, the breakpoint will trigger for any reference or composite service invoking that service. In contrast, if you add a breakpoint on a service reference, it will only break when that reference is invoked.

  • You can also set breakpoints on a composite service to debug validators and transformers (both inbound and outbound). You would do this if you want to see what’s going through a particular transformer or validator which may be used by a number of interactions.

  • If you configure a breakpoint to break on transactions, it will break into the SwitchYard TransactionHandler.handleMessage() method. This generates a stack trace that includes SwitchYard details (for example, an Exchange) that are visible in the SwitchYard context view, so that you can examine elements such as message contents and context properties.

In contrast to a Java debugger, the SwitchYard debugger enables you to invoke breakpoints during steps (such as transformation) during the execution of the service, right in the service bus:

  • Breakpoints on component services and composite references (in other words, providers) will break anytime they are invoked, regardless of who is calling them.

  • Breakpoints on composite services and component references (in other words, consumers) will break whenever they call out.

  • So, if you’re having a problem with a service, putting a breakpoint in the service, will allow you to see what’s going in or out. If you’re having a problem with a component or endpoint, putting a breakpoint on a consumer will allow you to see what’s going in/out, and where it’s going.

  • With regard to the locations within a service (for example, transformation), if you have a specific problem, such as if you’re seeing policy exceptions or transactions aren’t working the way you expect, you can set it to break during the policy phase or the transaction phase to see just what’s going on (which policies are required, which are provided).

The best way to understand the new debugger is to see it in action. We’ll do this by using the debugger with SwichYard "quickStart" example programs. Let’s get started!

Getting SwitchYard

Before we can see the debugger in action, we have to install the SwitchYard runtime and its corresponding Eclipse tooling. Luckily, downloading and installing JBoss software* is quick and painless (and free!)

The steps to install the SwitchYard runtime are:

The steps to install SwitchYard’s Eclipse tooling are:

(We’re using the latest versions of the software available when this post is being written.)

The Quickstarts

One of the helpful features included with JBoss projects are example programs referred to as “quickstarts.” As the name implies, the goal of these examples is to help users get started quickly in learning technologies provided by JBoss projects. As we mentioned earlier in this post, the approach that we’ll take is to introduce a bugs into quickstarts, and then use the debugger to locate these bugs.

To introduce SwitchYard applications to new users, we’ll examine the first quickstart that we’ll use in some detail. If you are already familiar with SwitchYard applications, you can skip over this section of the post.

Let’s start by using the debugger to interrupt a running service in a quickStart and enable us to examine the data in a message being processed by the service. After this, we’ll take things one step further and introduce a bug into a service and then use the debugger to find the cause of the bug and work around it.

Looking under the Hood of a Quickstart

Before we examine how the debugger can be used with a quickStart we’ll take a look at how quickstarts are implemented and how to use the SwitchYard editor.

The first quickstart that we’ll run makes use of Apache Camel to implement content based routing to route messages to selected services. This quickstart is aptly named: rules-camel-cbr. Before we run the quickstart, let’s take a quick look at how it works.

To understand how the quickstart is constructed and how it works, we’ll examine it by looking at these 3 elements:

  • The quickstart’s service based design. We’ll look at this through the SwitchYard visual editor.

  • SwitchYard’s integration of camel routes with the quickstart’s services.

  • The support for testing that SwitchYard provides.

Let’s start by looking at the design of the quickstart application and its services.

To import the quickstart into our JBDS workspace, navigate to File→Import→Maven→Existing Maven Projects:

debugger 2

Browse to the quickstarts directory under the directory into which you installed SwitchYard, select the quickstart and it is imported.

debugger 3

The SwitchYard Service Editor

The SwitchYard graphical application editor enables you to create services and references to services, configure gateway bindings for all the protocols that SwitchYard supports, configure message transformers (to convert messages from one format to another), create skeletons of the classes, interfaces, and unit tests for your services.

The service definitions that you create in the editor are stored in a file named switchyard.xml. In the quickstart, this file is located in the src/main/resources/META-INF directory. All the quickstarts that we’ll use in this post follow this same pattern. Let’s open this file in the editor and take a look around.

debugger 4

To open the file in the editor, simple double-click on the switchyard.xml file’s icon. When the editor opens, here’s what we see:

debugger 5

The big blue box in the center window is called the canvas. Here’s where you can see the graphical representation of the service definitions:

debugger 6

At this point, we should take a moment to understand the graphical symbols that are used in the service definitions.

The visual elements defined in switchyard.xml conform to the OASIS Service Component Architecture Assembly Model Specification (http://docs.oasis-open.org/opencsa/sca-assembly/sca-assembly-spec-v1.1.html). The Service Component Architecture (SCA) model provides standards for building SOA applications.

A green chevron represents a service definition. The corresponding purple chevron represents a reference to a service. The blue rectangles are service components. These are containers that can hold implementations or one or more services through references.

Why was this standard selected as the lingua franca of SwitchYard configuration? What advantages does using this standard give us? There are multiple levels of advantages:

  • The SwitchYard team is using a modular approach that makes it easier to define and maintain a service’s configuration. A switchyard.xml can contain binding info in the same file as the service implementation, but SCA also supports recursive composition, so that one service with just implementation details, can be included inside another. We’ll take a look at the SCA files and pictures that Switchyard tooling makes easy to create and maintain.

  • SwitchYard also wanted to make service interface (or the service "contract") information more explicit, and therefore easier to find.

  • Finally, the SwitchYard team had a choice. They could create a new configuration syntax, or they could try to use something that already existed, was an accepted open standard, and was supported by a vibrant community. (They chose the latter.) Also, SCA is a well-known model for service-oriented applications. But, it’s important to not get too hung-up over the underlying configuration model. The capabilities that the model makes possible, such as modularity, are more important. And, another reason to not worry too much about the configuration model is that SwitchYard provides you with tools such as Forge scripting (and someday soon a SCA editor) to make it easier to create and maintain services' configurations.

The set of fundamental service definition symbols is defined in the OASIS Service Component Architecture Assembly Model Specification here: http://docs.oasis-open.org/opencsa/sca-assembly/sca-assembly-1.1-spec-CD-01.html#_Toc193601722

The other symbols relate to the SwitchYard-specific service implementations and bindings. For example, the RoutingService is implemented as a Camel XML service, the DestinationService is implemented as a JBoss Drools service, and the Red, Blue, and Green services are implemented as Java Bean services.

The full range of options supported by SwitchYard is displayed in the Palette view:

debugger 7

(Yes, it’s a long list. You have to scroll to see all the options.)

One thing to keep is that while this service definitions are persisted in an .xml file, and while you are able to view the contents of that file, you should not attempt to edit the raw XML in that file. The editor has built in protections to ensure that you do not create an invalid configuration. These protections are not in effect if you edit the raw XML directly. Accordingly, while we’ll examine both the information available to you in the graphical editor and the switchyard.xml file, we’ll focus on using the editor.

Let’s start by examining the application service design as presented by the editor, in the context of the application logic flow, then we’ll look a bit deeper into how you can create and manage the application design through the editor.

What happens in the quickstart is a three step process:

  • First, the incoming message is routed, by the RoutingService to the DestinationService

  • Second, the DestinationService uses JBossDrools to determine the correct destination for that message, based on the content in the message

  • Third, the RoutingServer then routes the message to the correct final destination (the Red, Green, or Blue service

How is this all accomplished? Let’s look at the RoutingService definition. Select the RoutingService in the diagram, open the Properties view and you’ll see this:

debugger 8

Remember that this service is a Camel XML service. The implementation of that route is defined in the route.xml file. The route definitions take the form of a Spring DSL. (See http://camel.apache.org/spring-xml-extensions.html for more details.)

The contents of this file are pretty self-explanatory as the destination color determines the ultimate destination. For example:

<from uri="switchyard://RoutingService"/>
<to uri="switchyard://DestinationService"/>
  <choice>
    <when>
        <simple>${body.destination} == 'Red'</simple>
    <to uri="switchyard://RedService"/>

SwitchYard and Routing With Camel (with help from JBoss Drools)

What happens when the quickstart processes a message is:

First, the incoming message is routed, by the RoutingService to the DestinationService.

As seen in route.xml:

    <from uri="switchyard://RoutingService"/>
    <to uri="switchyard://DestinationService”/>

Let’s look at the DestinationService definition. Select the DestinationService in the diagram, open the Properties view and you’ll see this:

debugger 9

Then, the DestinationService service uses an MVEL statement to find the Widget class’s ID, and rules defined in JBoss Drools (remember that this service is implemented as a JBoss Drools service) to set the Destination value:

As seen in DestinationServiceRules.drl:

rule "Red Destination"
    when
        $widget : Widget(id matches "FF0000-.*")
    then
        $widget.getBox().setDestination("Red");
end

Then, the route logic continues in a structure to route the message to the correct destination:

OK. We have the Destination value set in each widget. But, how does the widget get routed to the correct destination?

Camel provides a Java DSL (Domain Specific Language) to implement routes. In the DSL, a camel route contains a source ("from") and a destination ("to). These reference the RoutingService and DestinationService interfaces that we just saw in the SwitchYard editor.

In the case of the quickstart, the route definitions take the form of a Spring DSL. The route is self-explanatory, even if you do not have experience with Camel. The destination service is selected based on the content; Red, Green, or Blue.

Test Support in SwitchYard

There’s just one more thing we have to look at before we run the quickstart - how to start the chain reaction of tasks that the quickstart will perform.

Testing server-side applications such as those built with SwitchYard can be difficult. Since this is server-side software, you have to install and run a server, the application has to be deployed to that server, and then you have to construct a client to access the application on the server. You can end up in a situation where you have to build either a throwaway test client, or a reusable test framework. Either way, you have to invest time and effort into building something other than your application.

Luckily, JBoss SwitchYard provides a built in framework that makes testing your applications fast and easy. This QuickStart makes use of the SwitchYardRunner class. SwitchYardRunner is a JUnit Runner class, but more than that, it starts up an embedded SwitchYard runtime. When this embedded runtime starts, your application is packaged up as a SwitchYard application that is deployed to the test instance.

To make use of SwitchYard’s test support, all you have to do is to annotate the test with the SwitchYardRunner JUnit test Runner class. This class will startup an embedded SwitchYard runtime, one for each test method, and then package up the test into a SwitchYard application and deploy that application to the runtime.

In addition to the SwitchYardRunner class, SwitchYard also makes testing easy by providing the TestMixIn feature. TestMixIns enable to turn on additional test support, based on the specific needs of your application. This quickstart makes use of the CDIMixIn to register its bean services. Some of the other TestMixIns support testing http services, JBoss Smooks transformations, and JMS services.

Building, Deploying, and Running the Quickstart

OK, enough talk. Let’s run the quickstart.

First, deploy the quickstart to a SwitchYard server. In JBDS, this is a simple task. It can be done with the server either started or stopped, but let’s start the server first so that you more easily spot the server logging messages when the quickstart is deployed.

To start the server, select it in the “servers” view, and press the start button.

debugger 10

The server console window will open, and you should see something like this:

21:21:59,145 INFO  [org.jboss.as] (Controller Boot Thread) JBAS015961: Http management interface listening on http://127.0.0.1:9990/management
21:21:59,146 INFO  [org.jboss.as] (Controller Boot Thread) JBAS015951: Admin console listening on http://127.0.0.1:9990
21:21:59,146 INFO  [org.jboss.as] (Controller Boot Thread) JBAS015874: WildFly 8.0.0.Final "WildFly" started in 4060ms

Then, to deploy the quickstart, select the server in the “servers” view again, right-click, select “Add/Remove Applications” and select the quickstart.

debugger 11

Switch back to the console view and you should see something like this:

INFO [org.jboss.as.server] (DeploymentScanner-threads - 1) JBAS018559: Deployed "switchyard-quickstart-rules-camel-cbr.jar" (runtime-name : "switchyard-quickstart-rules-camel-cbr.jar")

To run the client test program, select the rules-camel-cbr/src/test/java/org/switchyard/quickstarts/rules/camel/cbr/RulesCamelCBRTest.java Java source file, and run it as a JUnit test.

Switch back to the server console, and you’ll see the quick start’s output!

INFO  [org.switchyard.quickstarts.rules.camel.cbr.RedServiceBean] Red service processing boxed widget with id: FF0000-ABC-123
INFO  [org.switchyard.quickstarts.rules.camel.cbr.GreenServiceBean] Green service processing boxed widget with id: 00FF00-DEF-456
INFO  [org.switchyard.quickstarts.rules.camel.cbr.BlueServiceBean] Blue service processing boxed widget with id: 0000FF-GHI-789

And the green bar appears!

debugger 12

Now, we’ll use the debugger to interrupt a running service in a QuickStart and enable us to examine the data in a message being processed by the service. After this, we’ll take things one step further and introduce a bug into a service and then use the debugger to find that bug.

Setting a Breakpoint in the Debugger

Let’s start by setting a breakpoint on the Blue service. We’ll use this breakpoint to enable us to view the contents of the message received by the service. For the purposes of our first example, we’ll use the Blue service.

To set a breakpoint in the SwitchYard editor, first position the cursor over the service’s green chevron icon. A small palette of icons is displayed:

debugger 13

To set a breakpoint on the service, select the eyeglasses icon. The presence of this icon on a service definition as seen in the SwitchYard editor indicates that a breakpoint is set:

debugger 14

Notes that as we are adding a breakpoint on the service, the breakpoint will trigger for any reference or composite service invoking that service. In contrast, if you add a breakpoint on a service reference, it will only break when that reference is invoked.

To view and modify the breakpoint’s properties, open the Debug perspective and look in the breakpoints view:

debugger 15

And then right-click on the breakpoint, to view and edit the breakpoint’s properties:

debugger 16

For our example, we’ll use the default properties. We’re mainly concerned with the breakpoint being triggered at service entry.

Now that our breakpoint has been defined, let’s run the RulesCamelCBRTest program again.

To run the test with the debugger, right-click on RulesCamelCBRTest, select Debug As→JUnit Test:

debugger 17

When the breakpoint is reached, the program is suspended. If we look in the Variables view in the Debug perspective, we can see the incoming message and the values that controlled the content-based routing of a message to the Blue service:

debugger 18

Now that we’ve seen the quickstart run correctly, it’s time to introduce a bug, and then use the debugger to find it. For this illustration, we’ll use a different quickstart.

Giving a Quickstart a Bug

Remember the scene in the movie “Independence Day,” when Will Smith uploads a software virus into the evil aliens’ spaceship? Let’s do something similar and add a bug into a quickstart, and then use the debugger to find the bug and even fix it.

Some of the types of bugs that you have to deal with in a services and message based system involve when there are problems in the content in the messages, and how the services are (or are not) able to handle those problems. What sorts of bad things can happen to good messages? Missing a field, wrong namespace, malformed XML, errors in the headers, etc. The debugger makes it possible to tweak a message to debug a problem, without having to redeploy the service.

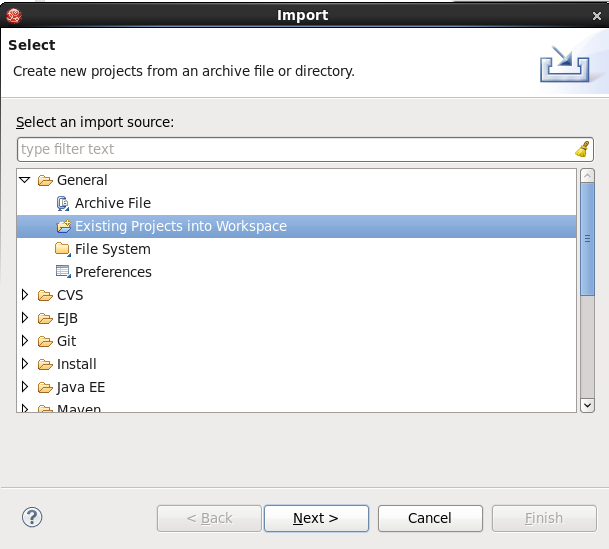
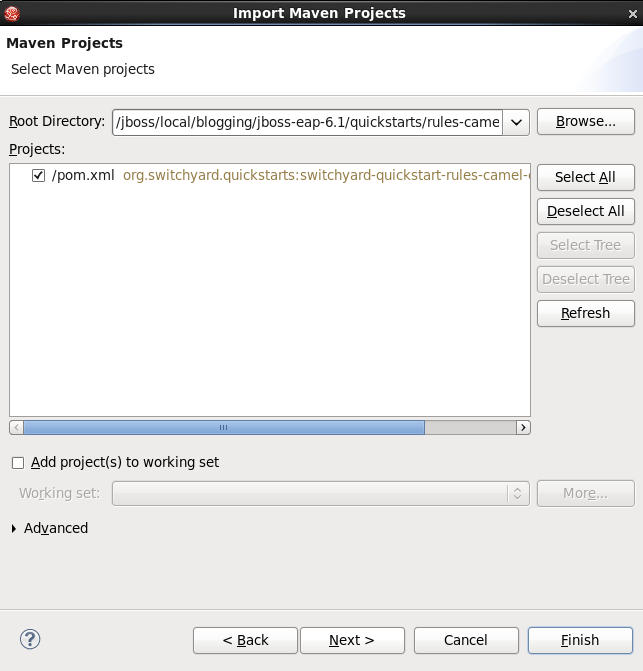
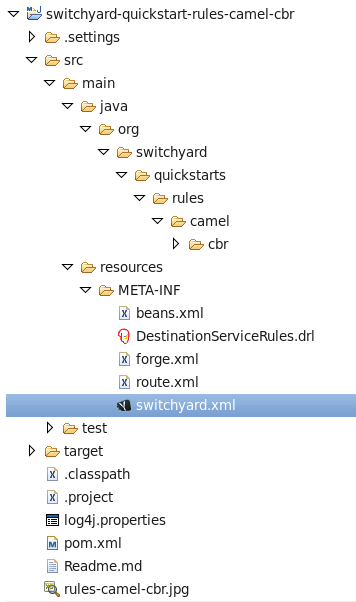
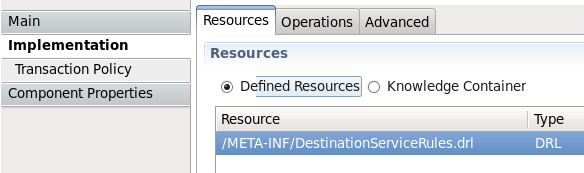
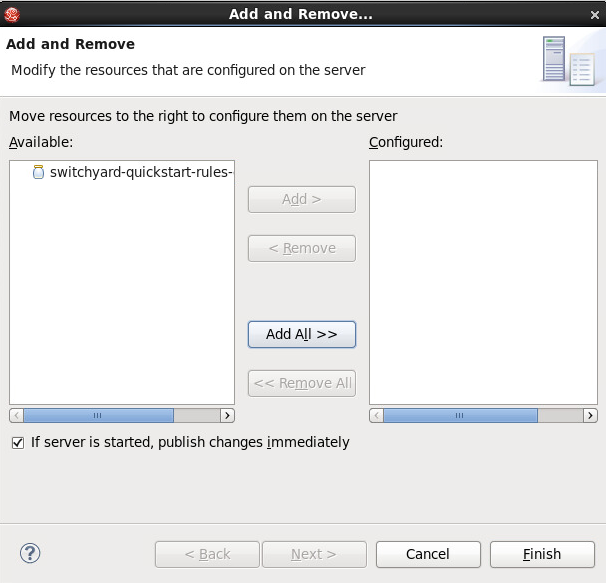
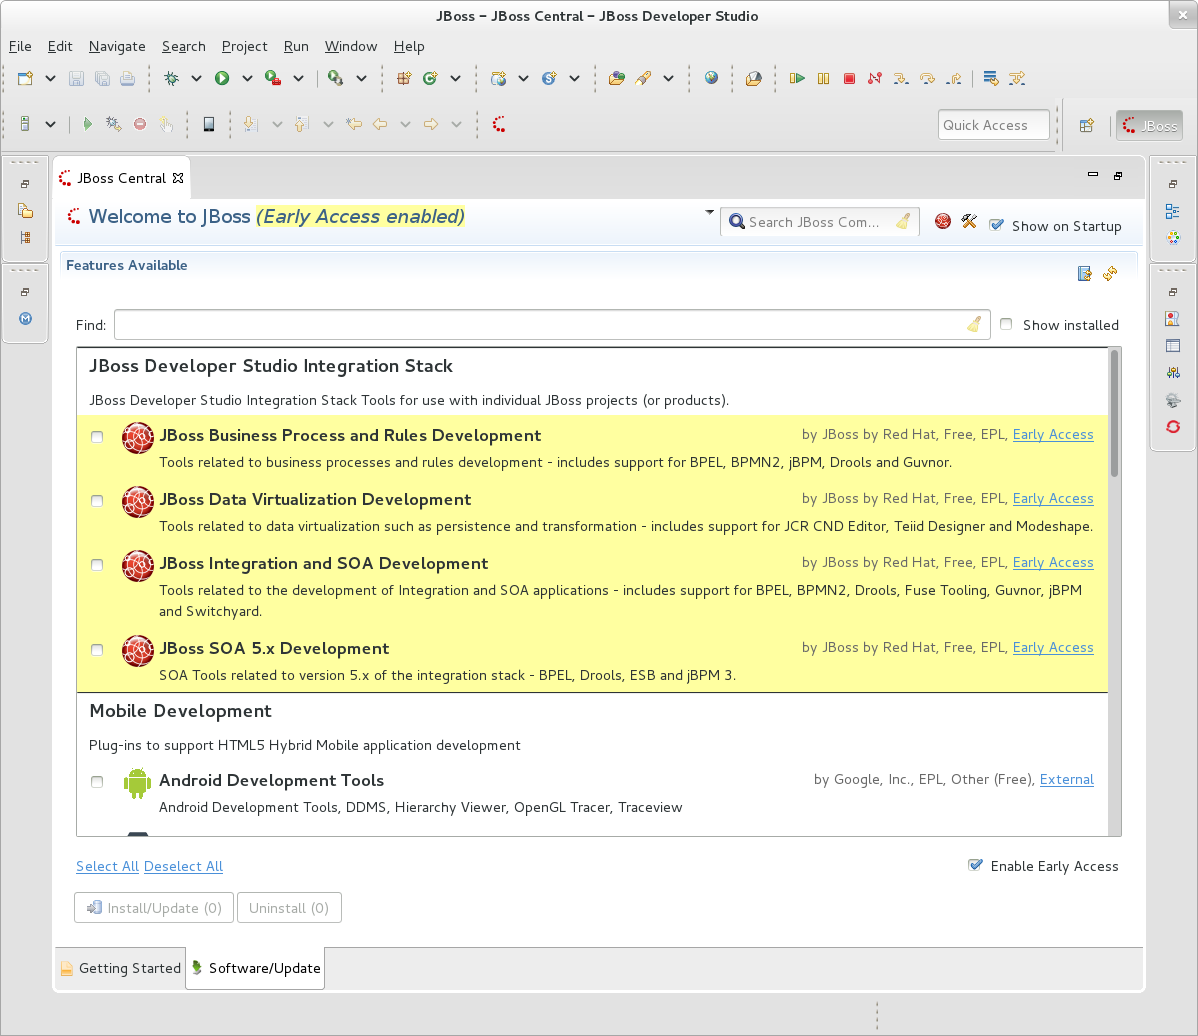
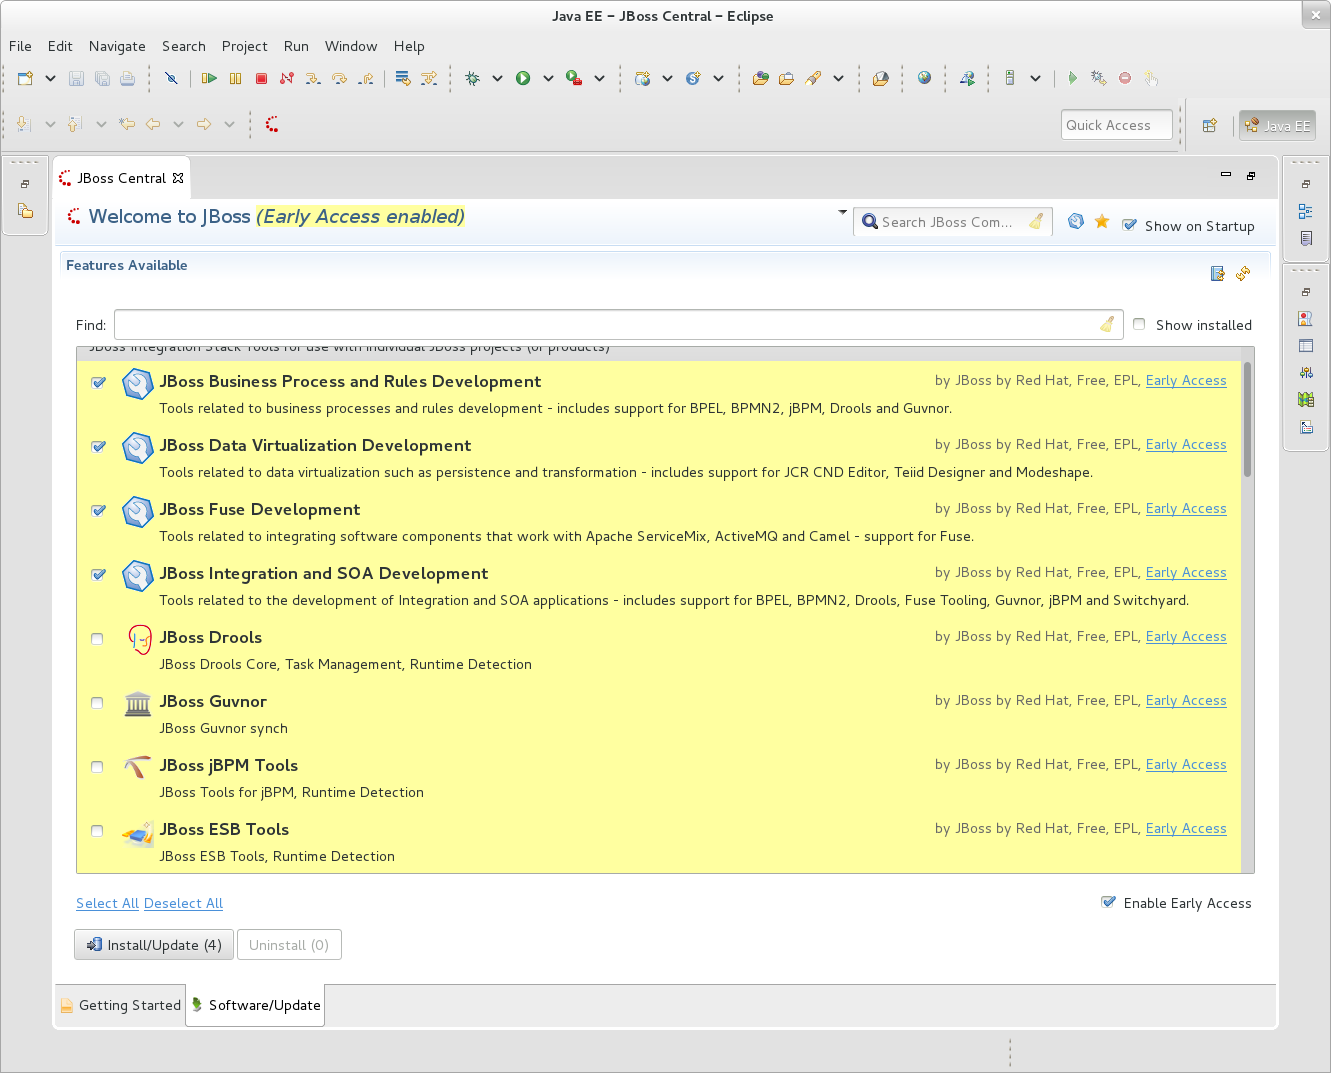
The quickstart that we’ll look at is “validate-xml.” This quickstart demonstrates the SwitchYard XML validator. The quickstart deploys a service that accepts a message and returns an object that is transformed with XLST. The incoming message is checked for XML validity, so that malformed messages are caught. Before we can run the quickstart, it must be deployed in the same manner as the rules-camel-cbr quickstart that we looked at earlier in this article.

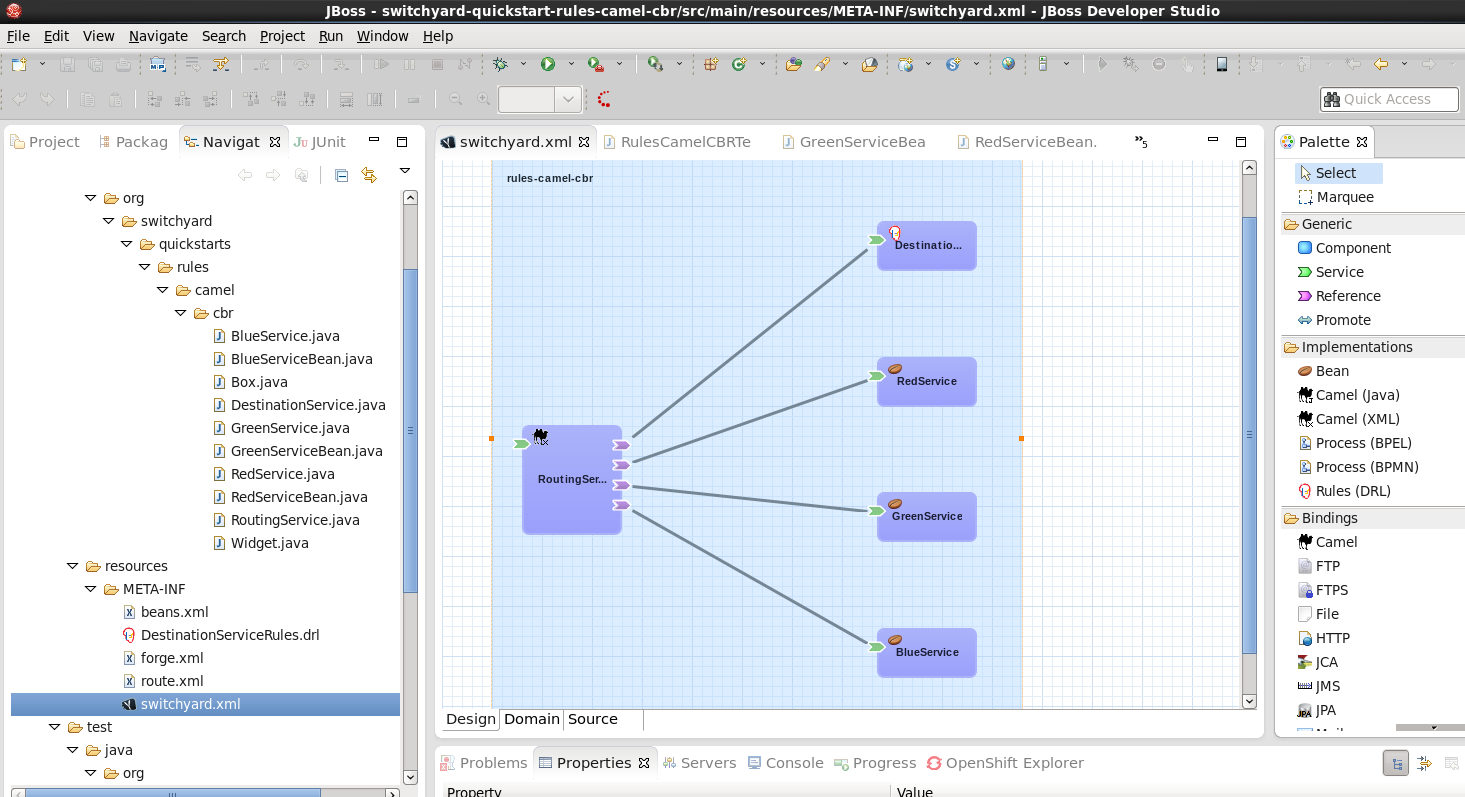
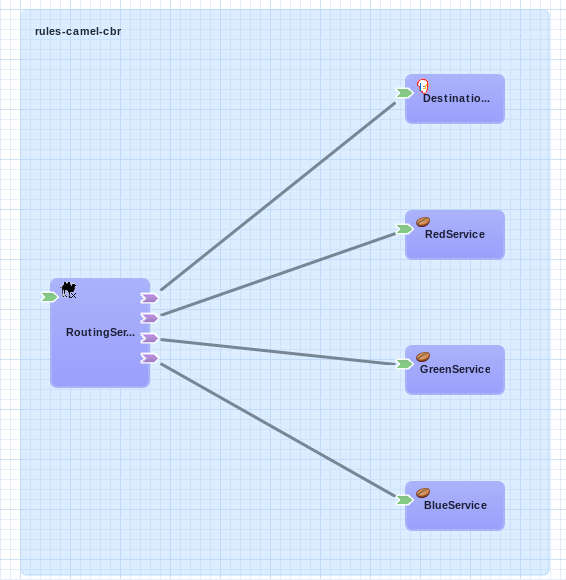
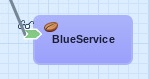
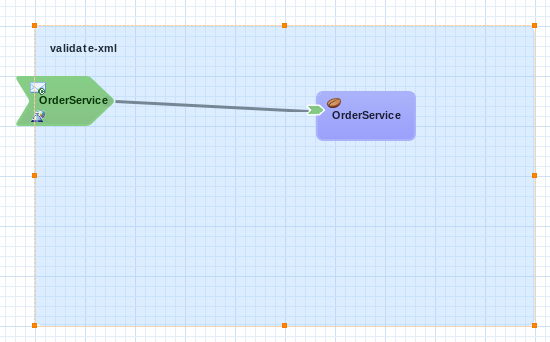
The quickstart’s application diagram is very simple as only one service (“OrderService”) is implemented. This service only accepts a message and returns an object that is processed by the XLST transformer, but it’s adequate for our purposes. The diagram looks like this:

debugger 19

The test application that we want to run is: validate-xml/src/test/java/org/switchyard/quickstarts/validate/xml/WebServiceTest.java

This application executes separate two Junit tests. First, it verifies that a properly formatted SOAP message can be transformed and validated, and then it verifies that an intentionally malformed SOAP message (that is, a message that contains invalid XML) is caught.

Before we look at causing and catching a bug, let’s examine the message tansformation that is performed by this quickstart. The transformation is performed with the order.xslt file in the quickstart. It’s a simple transformation in that it transforms incoming messages that look like this:

<soapenv:Envelope xmlns:soapenv="http://schemas.xmlsoap.org/soap/envelope/">
  <soapenv:Header/>
  <soapenv:Body>
  <orders:order xmlns:orders="urn:switchyard-quickstart:validate-xml:0.1.0">
     <orderId>PO-19838-XYZ</orderId>
     <itemId>BUTTER</itemId>
     <quantity>200</quantity>
  </orders:order>
  </soapenv:Body>
</soapenv:Envelope>

Into objects that look like this:

<SOAP-ENV:Envelope xmlns:SOAP-ENV="http://schemas.xmlsoap.org/soap/envelope/">
  <SOAP-ENV:Header/>
  <SOAP-ENV:Body>
  <orders:orderAck xmlns:orders="urn:switchyard-quickstart:validate-xml:0.1.0">
     <orderId>PO-19838-XYZ</orderId>
     <accepted>true</accepted>
     <status>Order Accepted</status>
  </orders:orderAck>
  </SOAP-ENV:Body>
</SOAP-ENV:Envelope>

The change simply indicates whether the incoming order was accepted.

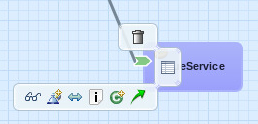
If we set our breakpoint on the “OrderService” service:

debugger 20

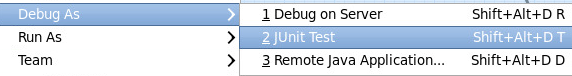
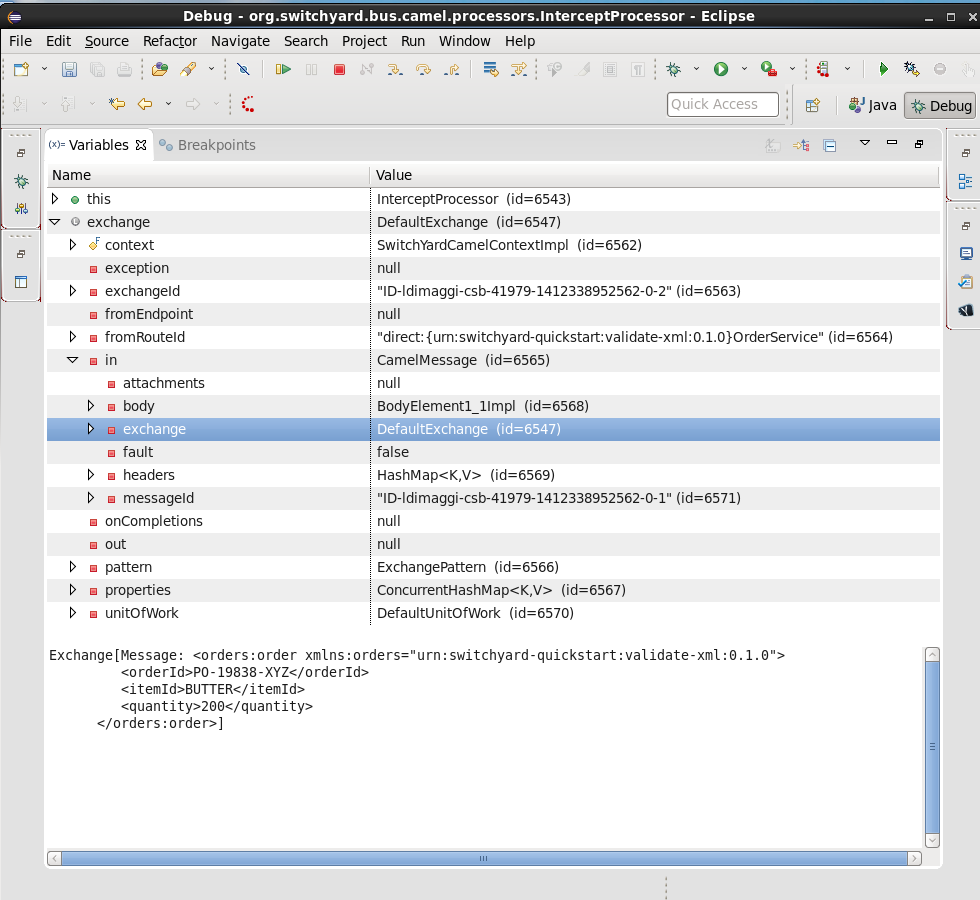
And then run/debug the WebServiceTest, we can view the message, before and after its transformation, in the debugger. Here’s the message before transformation:

debugger 21

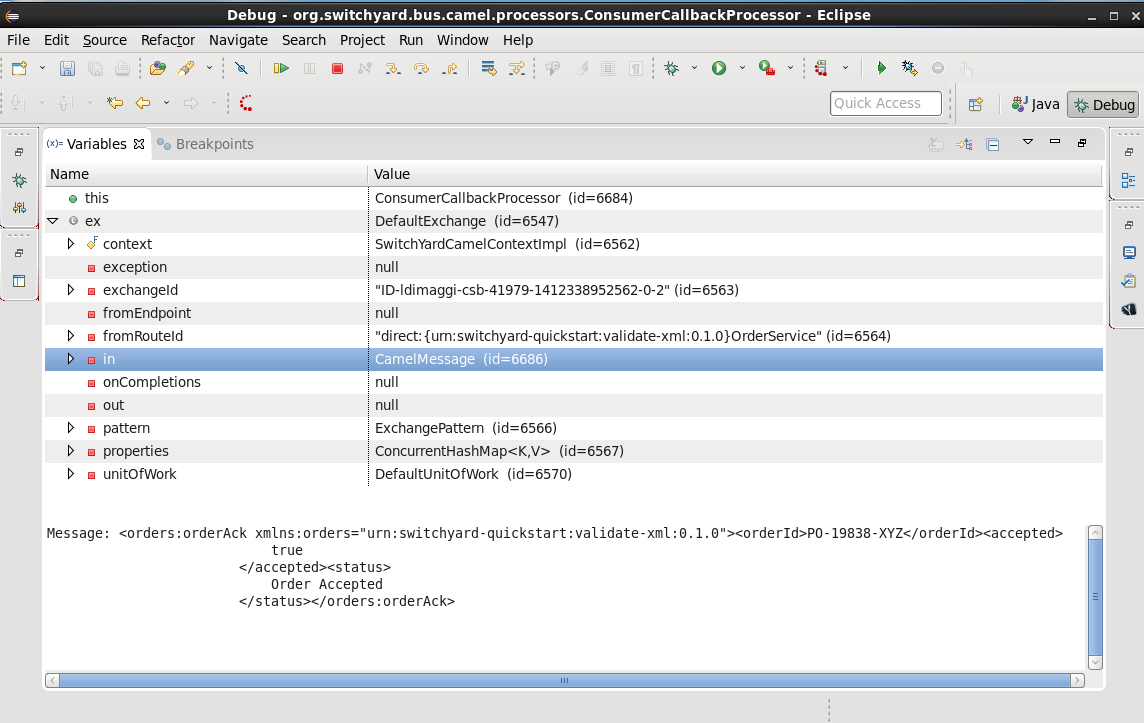
And here’s the message after its transformation:

debugger 22

The second test in the WebServiceTest intentionally sends a message that includes an invalid XML element.

The invalid SOAP message looks like this:

<soapenv:Envelope xmlns:soapenv="http://schemas.xmlsoap.org/soap/envelope/">
  <soapenv:Header/>
  <soapenv:Body>
  <orders:order xmlns:orders="urn:switchyard-quickstart:validate-xml:0.1.0">
     <orderId>PO-19838-XYZ</orderId>
     <itemId>BUTTER</itemId>
     <quantity>200</quantity>
     <invalid-element>This element is not allowed by XML Schema.</invalid-element>
  </orders:order>
  </soapenv:Body>
</soapenv:Envelope>

Yes, it’s easy to spot the invalid XML. ;-)

Let’s expand on this test application a bit and alter it to not gracefully trap the error resulting from the invalid XML. To do this, we’ll edit the invokeOrderWebServiceValidationFail() method and change this:

Assert.assertTrue("Unexpected response: " + response, response.contains("1 validation error(s)") && response.contains("invalid-element"));

To this:

Assert.assertFalse("Unexpected response: " + response, response.contains("1 validation error(s)") && response.contains("invalid-element"));

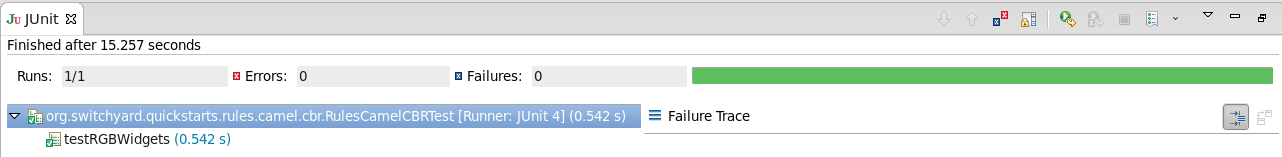
So that when we run the test, we see this JUnit error:

java.lang.AssertionError: Unexpected response: <soap:Envelope xmlns:soap="http://schemas.xmlsoap.org/soap/envelope/"><soap:Body><soap:Fault><faultcode>soap:Server</faultcode><faultstring>SWITCHYARD014000: Validator 'org.switchyard.validate.xml.internal.XmlValidator' failed: 1 validation error(s):
org.xml.sax.SAXParseException: cvc-complex-type.2.4.d: Invalid content was found starting with element 'invalid-element'. No child element is expected at this point.
</faultstring></soap:Fault></soap:Body></soap:Envelope>

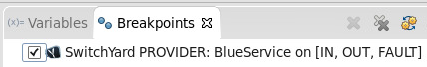
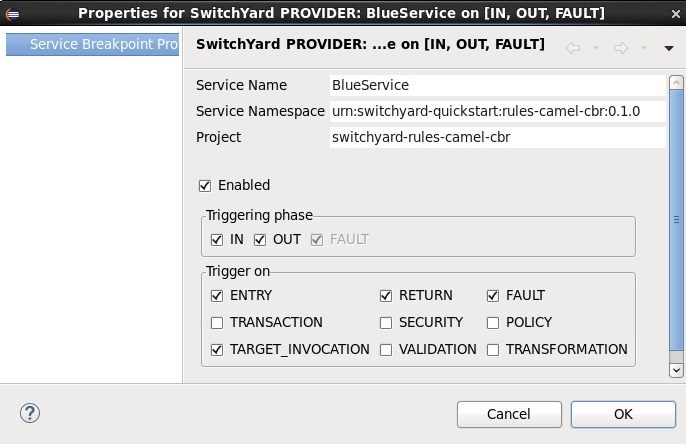
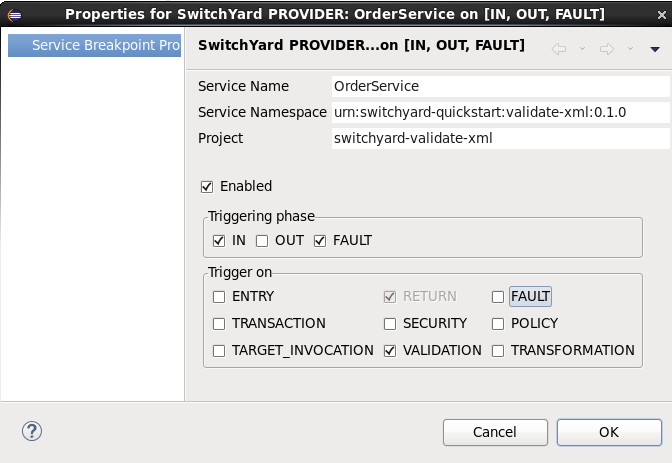
Before we can debug the OrderService, we must set our breakpoint:

debugger 23

Then we edit the breakpoint’s properties. For our example, we want the trigger to be set for the validation of incoming messages:

debugger 24

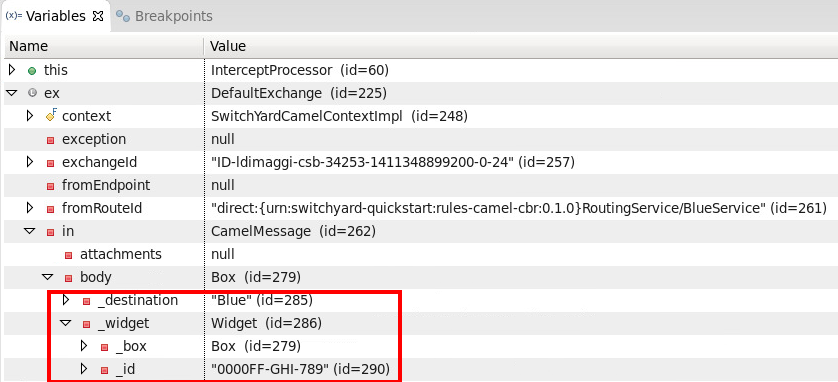
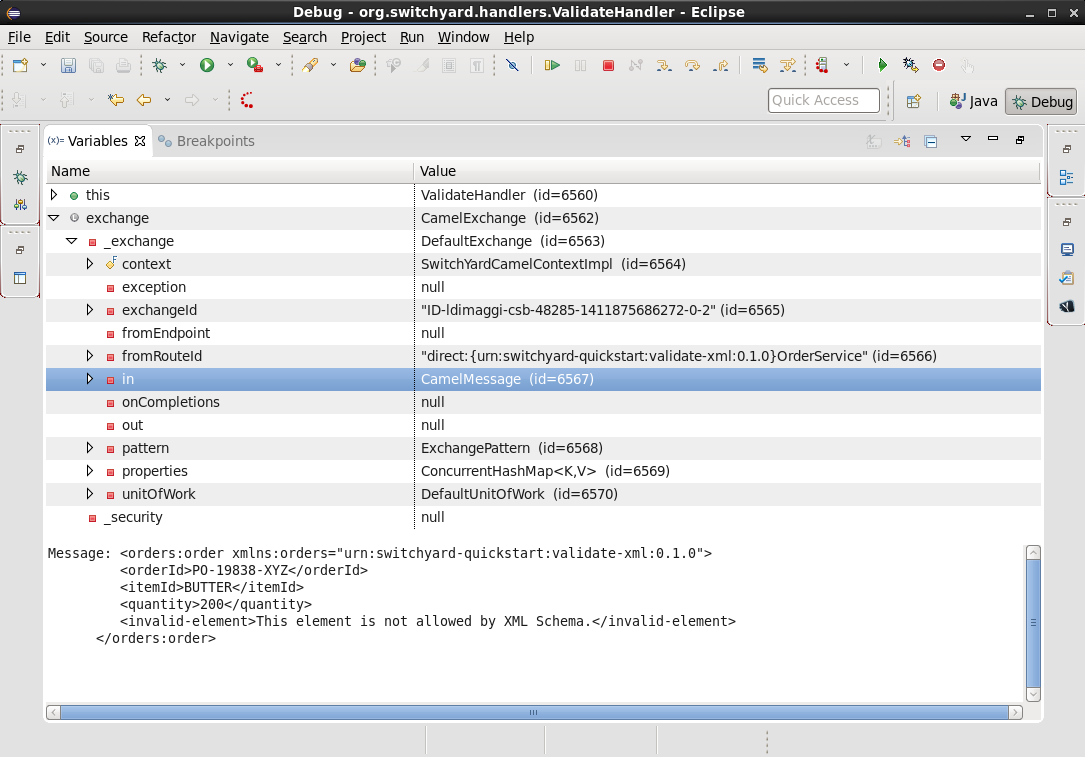
When we run/debug the WebServiceTest program, the breakpoint is reached and we can examine the message contents:

debugger 25

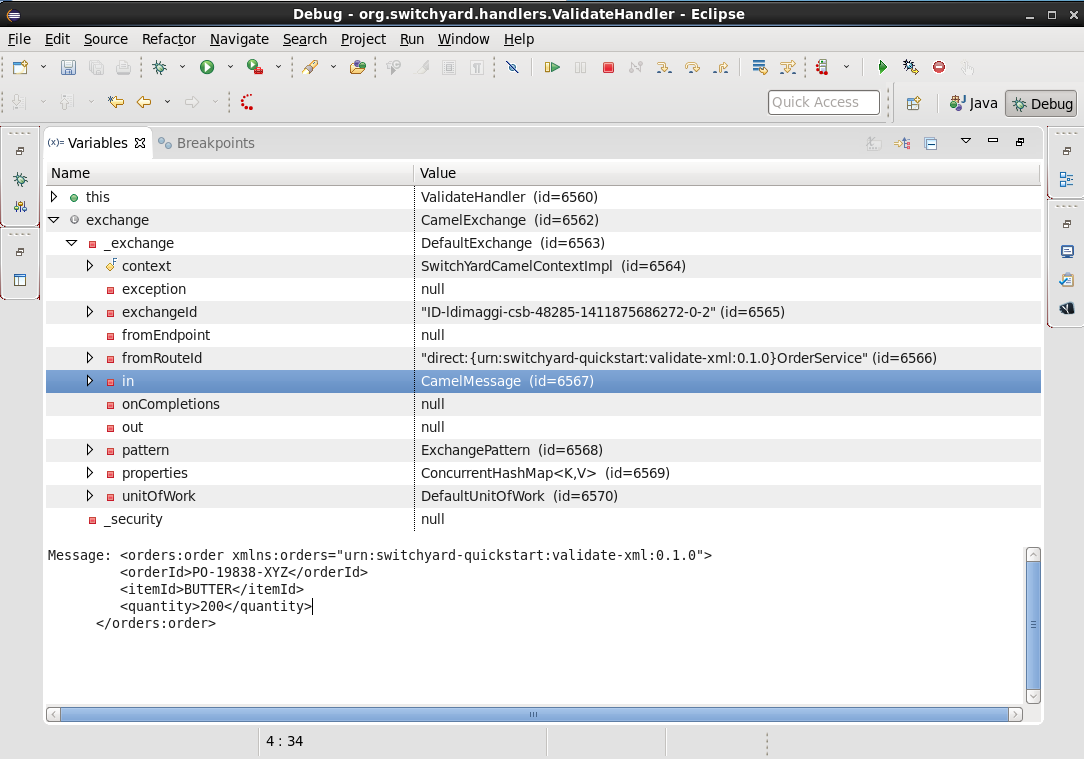
And, there’s the invalid XML element. What makes the debugger especially useful is that we can now edit the message and remove the invalid XML:

debugger 26

And then allow the program to resume its operation. In this way, we can determine if the program has any other bugs before we correct the cause of the invalid XML, redeploy, etc.

In Conclusion

We’ve taken an introductory look at the new SwitchYard debugger in this article. The debugger enables you to debug not just a class or method, but a Switchyard service. The debugger is configured through the SwitchYard graphical service/application editor and enables you to both monitor and control the operation of a service to make it easier for you to find those pesky bugs and is a great addition to the SwitchYard developer toolkit.

Acknowledgements

The author would like to thank Rob Cernich for his input and reviews of the article as it was being written, Keith Babo for his background on the SwitchYard editor, and Jiri Sedlacek for his painstaking review of my sometimes suspect grammar. (Many thanks!)

References

JBoss Tools Integration Stack 4.2.0.Beta1 / JBoss Developer Studio Integration Stack 8.0.0.Beta1

jbosstools jbdevstudio blog header

The Integration Stack for JBoss Tools Developer Studio is a set of plugins for Eclipse that provides tooling for the following frameworks.

JBoss Business Process and Rules Development

  • BPEL Designer - Orchestrating your business processes.

  • BPMN2 Modeler - A graphical modeling tool which allows creation and editing of Business Process Modeling Notation diagrams using graphiti.

  • Drools - A Business Logic integration Platform which provides a unified and integrated platform for Rules, Workflow and Event Processing.

  • jBPM - A flexible Business Process Management (BPM) suite.

JBoss Data Virtualization Development

  • Modeshape - A distributed, hierarchical, transactional and consistent data store with support for queries, full-text search, events, versioning, references, and flexible and dynamic schemas. It is very fast, highly available, extremely scalable, and it is 100% open source.

  • Teiid Designer - A visual tool that enables rapid, model-driven definition, integration, management and testing of data services without programming using the Teiid runtime framework.

JBoss Integration and SOA Development

  • All of the Business Process and Rules Development plugins, plus…​

  • Fuse Apache Camel Tooling - A graphical tool for integrating software components that works with Apache ServiceMix, Apache ActiveMQ, Apache Camel and the FuseSource distributions.

  • SwitchYard - A lightweight service delivery framework providing full lifecycle support for developing, deploying, and managing service-oriented applications.

SOA 5.x Development

  • JBoss ESB - An enterprise service bus for connecting enterprise applications and services.

  • jBPM3 - A flexible Business Process Management (BPM) Suite - JBoss Enterprise SOA Platform 5.3.x compatible version.

All of these components have been verified to work with the same dependencies as JBoss Tools 4.2 and Developer Studio 8.

Installation

To install the Integration Stack tools, first install JBoss Developer Studio from the all-in-one installer, bundled and configured out of the box with everything you need to get started. Alternatively, if you already have eclipse-jee-luna installed, you can install JBoss Developer Studio or JBoss Tools from the Eclipse Marketplace via Help > Eclipse Marketplace…​

jbtis luna em

Once Developer Studio is installed, restart Eclipse and select the Software/Update tab in the JBoss Central view. The current 8.0.0.Beta1 integration stack is available as "Early Access" so you must check the "Enable Early Access" checkbox in the installer window. Select the items you’d like to install:

jbdsis ea

The standard p2 installer is available for JBDSIS. Simply start jbdevstudio or eclipse-with-jbds, then:

       Help > Install New Software...
       Add...
       - use this for 'Location:'
         https://devstudio.redhat.com/updates/8.0-development/integration-stack/

The community JBoss Tools Integration Stack (JBTIS) installation is easy as well. If you already have eclipse-jee-luna installed, install JBoss Tools from the Eclipse Marketplace via Help > Eclipse Marketplace…​

jbtis luna em

Once JBoss Tools is installed, restart Eclipse and select the Software/Update tab in the JBoss Central view. The current 4.2.0.Beta1 integration stack is available as "Early Access" so you must check the "Enable Early Access" checkbox in the installer window. Select the items you’d like to install:

jbtis ea

The standard p2 installer is available for JBTIS. Simply start eclipse-with-jbt, then:

       Help > Install New Software...
       Add...
       - use this for 'Location:'
         http://download.jboss.org/jbosstools/updates/development/luna/integration-stack/

Note: If you installed into your own Eclipse you should bump up the launch resource parameters:

--launcher.XXMaxPermSize 256m --launcher.appendVmargs -vmargs -Dosgi.requiredJavaVersion=1.6 -XX:MaxPermSize=256m -Xms512m -Xmx1024m

What’s Been Updated?

This is a Beta1 release so some things are in flux but virtually every component has something new or updated. Here’s a small list of what’s new:

Fuse Tooling

  • Improved server adapters for JBoss Fuse Tooling. More logical deployment and publishing of your projects from the Servers view.

  • There’s new Camel route debug support in the Fuse Camel route editor.

See Lars Heinemann’s Blog for more insights.

Teiid Designer

Three releases for Teiid Designer, see Teiid Designer 8.4, Teiid Designer 8.5 and Teiid Designer 8.6 What’s New.

Keep up to date with the JBoss Tools home

Don’t miss the Features tab for up to date information on your favorite Integration Stack component!

JBoss Tools 4.29.0.Final for Eclipse 2023-09

by Stéphane Bouchet on Nov 02, 2023.

JBoss Tools 4.28.0.Final for Eclipse 2023-06

by Stéphane Bouchet on Jul 03, 2023.

JBoss Tools for Eclipse 2023-06M2

by Stéphane Bouchet on Jun 05, 2023.

JBoss Tools 4.27.0.Final for Eclipse 2023-03

by Stéphane Bouchet on Apr 07, 2023.

JBoss Tools for Eclipse 2023-03M3

by Stéphane Bouchet on Mar 10, 2023.

Looking for older posts ? See the Archived entries.
back to top