Happy to announce 4.16.0.AM1 (Developer Milestone 1) build for Eclipse 2020-06.
Downloads available at JBoss Tools 4.16.0 AM1.
What is New?
Full info is at this page. Some highlights are below.
Happy to announce 4.16.0.AM1 (Developer Milestone 1) build for Eclipse 2020-06.
Downloads available at JBoss Tools 4.16.0 AM1.
Full info is at this page. Some highlights are below.
JBoss Tools 4.15.0 and Red Hat CodeReady Studio 12.15 for Eclipse 2020-03 are here waiting for you. Check it out!
Red Hat CodeReady Studio comes with everything pre-bundled in its installer. Simply download it from our Red Hat CodeReady product page and run it like this:
java -jar codereadystudio-<installername>.jar
JBoss Tools or Bring-Your-Own-Eclipse (BYOE) CodeReady Studio require a bit more:
This release requires at least Eclipse 4.15 (2020-03) but we recommend using the latest Eclipse 4.15 2020-03 JEE Bundle since then you get most of the dependencies preinstalled.
Once you have installed Eclipse, you can either find us on the Eclipse Marketplace under "JBoss Tools" or "Red Hat CodeReady Studio".
For JBoss Tools, you can also use our update site directly.
http://download.jboss.org/jbosstools/photon/stable/updates/
Our main focus for this release was a new tooling for the Quarkus framework, improvements for container based development and bug fixing. Eclipse 2020-03 itself has a lot of new cool stuff but let me highlight just a few updates in both Eclipse 2020-03 and JBoss Tools plugins that I think are worth mentioning.
Likewise, there is now completion, hover, documentation and validation for the MicroProfile properties from REST Client.
After registering a REST client using @RegisterRestClient
like so:
package org.acme;
import javax.ws.rs.GET;
import javax.ws.rs.Path;
import javax.ws.rs.core.Response;
import org.eclipse.microprofile.rest.client.inject.RegisterRestClient;
@RegisterRestClient
public interface MyServiceClient {
@GET
@Path("/greet")
Response greet();
}
The related MicroProfile Rest config properties will have language feature support (completion, hover, validation, etc.).
Change the Java code so that the configuration key is changed:
package org.acme;
import javax.ws.rs.GET;
import javax.ws.rs.Path;
import javax.ws.rs.core.Response;
import org.eclipse.microprofile.rest.client.inject.RegisterRestClient;
@RegisterRestClient(configKey = "myclient")
public interface MyServiceClient {
@GET
@Path("/greet")
Response greet();
}
and notice the code assist is changed accordingly:
Likewise, there is now completion, hover, documentation and validation for the MicroProfile Health artifacts.
So if you have the following Health class:
package org.acme;
import org.eclipse.microprofile.health.Health;
@Health
public class MyHealth {
}
you will get a validation error (as the class does not implement the HealthCheck
interface:
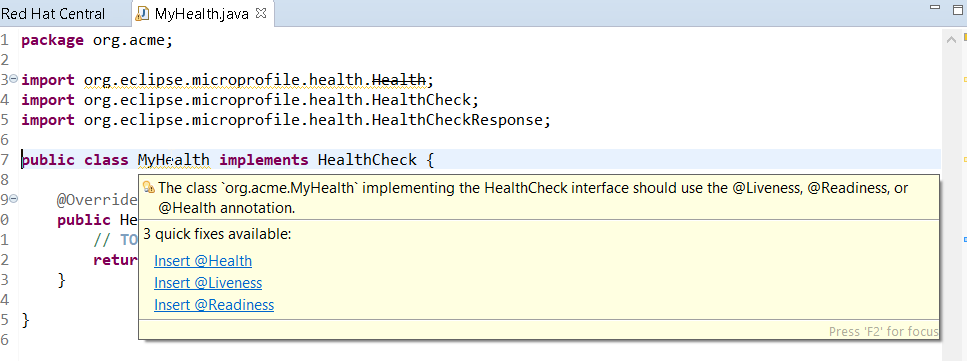
Similarly, if you have a class that implements HealthCheck
but is not annotated with Health
, some workflow applies:
package org.acme;
import org.eclipse.microprofile.health.HealthCheck;
import org.eclipse.microprofile.health.HealthCheckResponse;
public class MyHealth implements HealthCheck {
@Override
public HealthCheckResponse call() {
// TODO Auto-generated method stub
return null;
}
}
you will get a validation message (as the class is not annotated with Health
interface):
As there are several ways to fix the problem, then several quick fixes are proposed.
With the Quarkus extensions ecosystem growing, we improved information about extensions in the Quarkus project wizard.
When you select an extension in the wizard, you will see the extension description in the lower side of the wizard. If the extension has a guide on the Quarkus web site, a link will also be displayed and clicking on that link will open the guide on your local web browser.
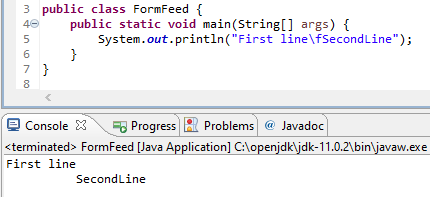
The interpretation of ASCII control characters in the Console View was extended to
recognize the characters: \f
- form feed and \v
- vertical tab (in languages that support it).
This feature is disabled by default. You can enable it on the Run/Debug > Console preference page.
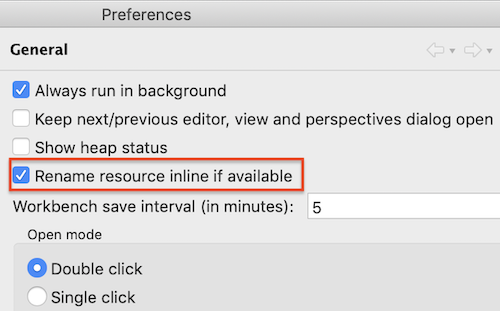
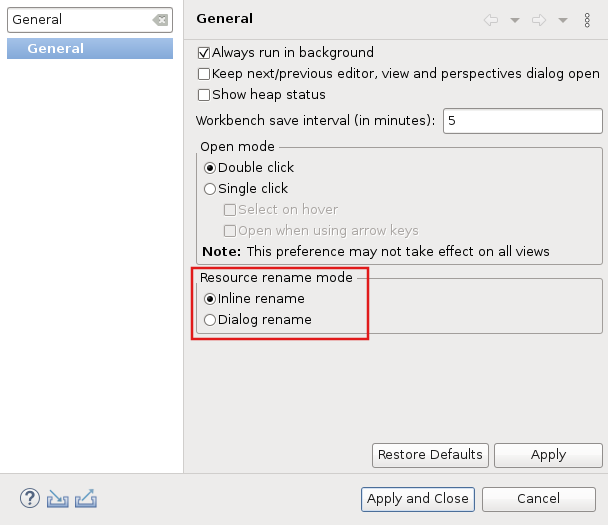
A preference has been added in the General preferences page, that allows you to select the resource renaming mode in the Project Explorer: either open an inlined text field or a dialog. By default, the inline rename mode is selected.
The preference can also be specified via product customization:
org.eclipse.ui.workbench/RESOURCE_RENAME_MODE=inline
org.eclipse.ui.workbench/RESOURCE_RENAME_MODE=dialog
Rename that would affect more than 1 resource is always performed with a dialog. |
To improve interactive performance, redraw is turned off by default during the collapse and expand operation of tree viewers. This significantly improves these operations compared to drawing the updates synchronously.
Java™ 14 is available and Eclipse JDT supports Java 14 for the Eclipse 4.15 release.
The release notably includes the following Java 14 features:
JEP 361: Switch Expressions (Standard).
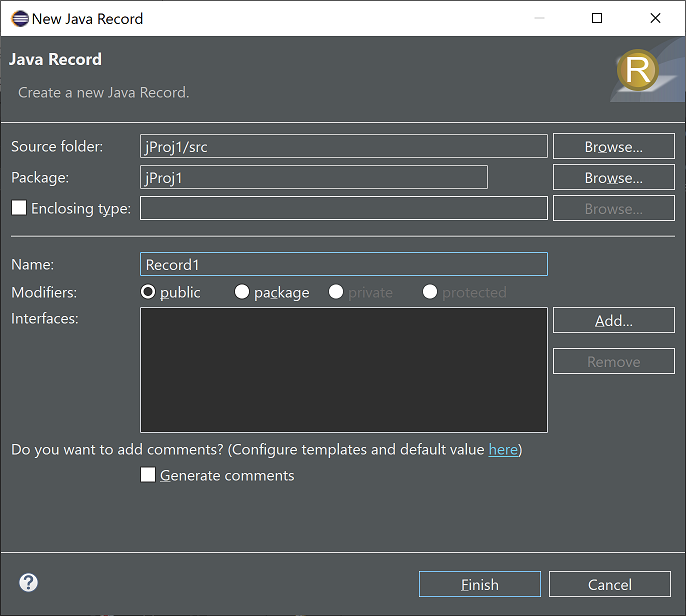
JEP 359: Records (Preview).
JEP 368: Text Blocks (Second Preview).
JEP 305: Pattern Matching for Instanceof (Preview).
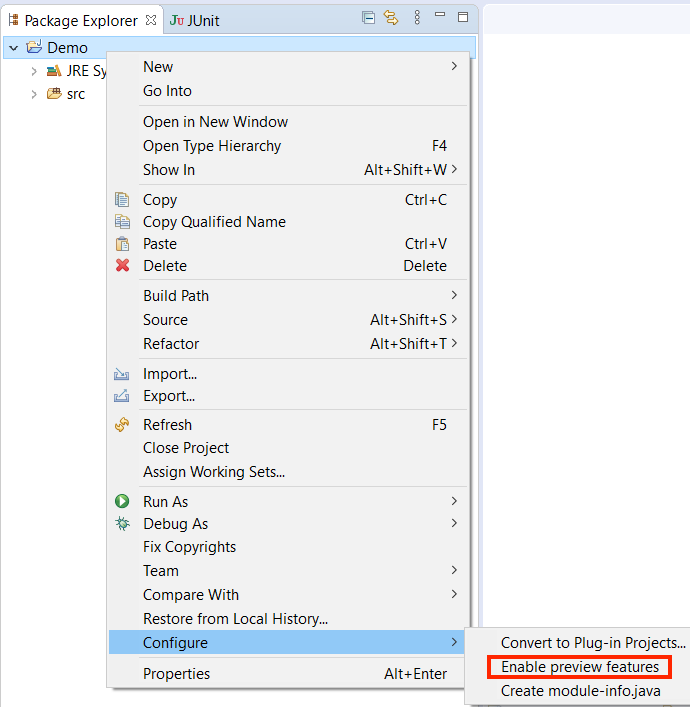
Please note that preview option should be on for preview language features. For an informal introduction of the support, please refer to Java 14 Examples wiki.
Content Assist now supports subword patterns, similar to Eclipse Code Recommenders
and other IDEs. For example, completing on addmouselistener
proposes results
like addMouseMoveListener
and addMouseWheelListener
.
This feature can be enabled using the Show subword matches option on the Java > Editor > Content Assist preference page.
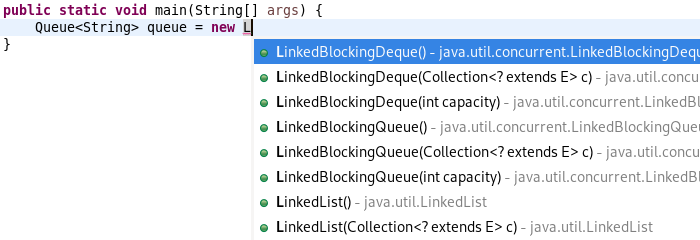
Content Assist will prioritize displaying constructor completions whose declaring type inherits from the expected return type within the completion context.
For example, completing on :
Queue<String> queue = new L
prioritizes constructors for LinkedBlockingQueue
, LinkedBlockingDeQueue
and LinkedList
.
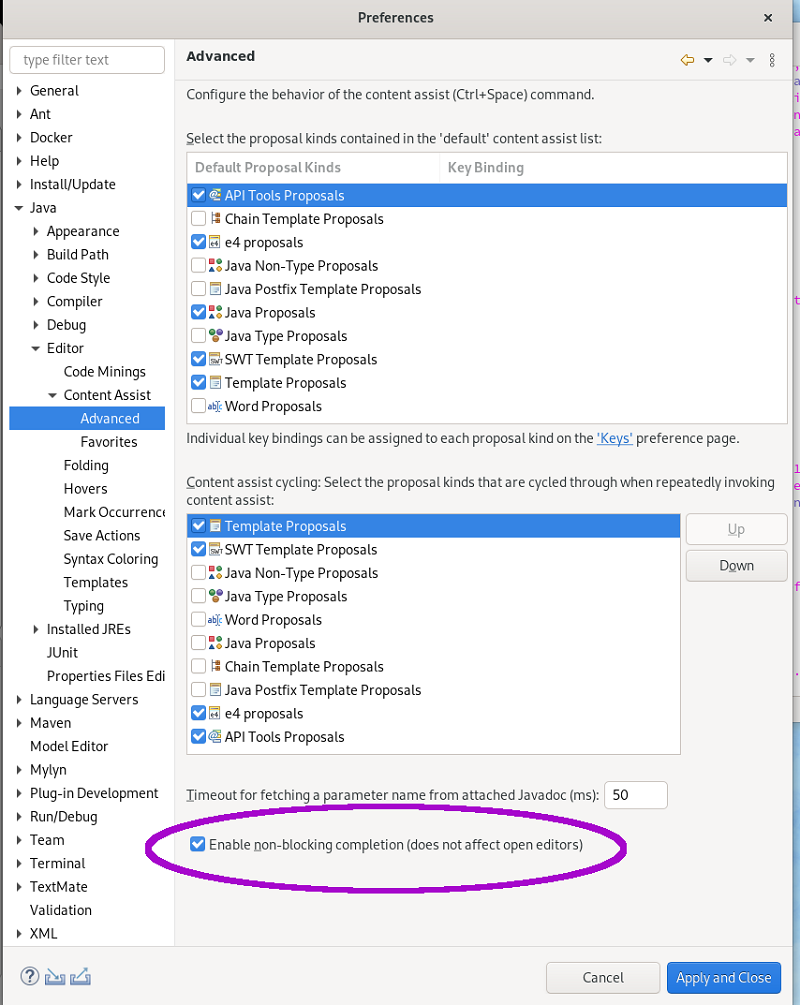
Code completion in the Java editor can now be run in a separate non-UI thread to prevent UI freezes in case of long computations. To enable this non-blocking computation, go to Preferences > Java > Editor > Content Assist > Advanced and check Do not block UI Thread while computing completion proposals preference. This option is currently disabled by default.
Non-blocking completion is useful when completion proposals are long to compute, as it allows you to type or use other parts of the IDE in the meantime.
Some completion participants may prevent this option from being effective (typically
if the Java completion extension doesn’t declare requiresUIThread="false"
),
so the UI thread may still be used even if this option is set.
A quick fix has been added to wrap an Optional
statement.
The options for a primitive statement are: Optional.empty()
and Optional.of()
.
Type statements also have Optional.ofNullable()
.
Example for type objects:
Selecting Wrap with nullable Optional for type object results in:
Example for primitive:
Selecting Wrap with Optional for primitive results in:
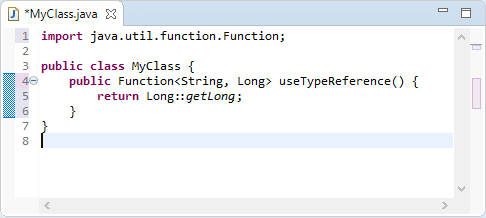
A new clean up has been added that simplifies the lambda expression and the method reference syntax and is enabled only for Java 8 and higher.
The clean up removes parenthesis for a single untyped parameter, return statement for a single expression and brackets for a single statement. It replaces a lambda expression by a creation or a method reference when possible.
To select the clean up, invoke Source > Clean Up…, use a custom profile, and on the Configure… dialog select Simplify lambda expression and method reference syntax on the Code Style tab.
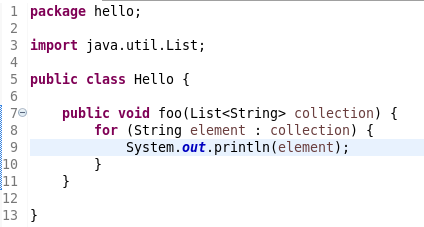
For the given code:
You get this after the clean up:
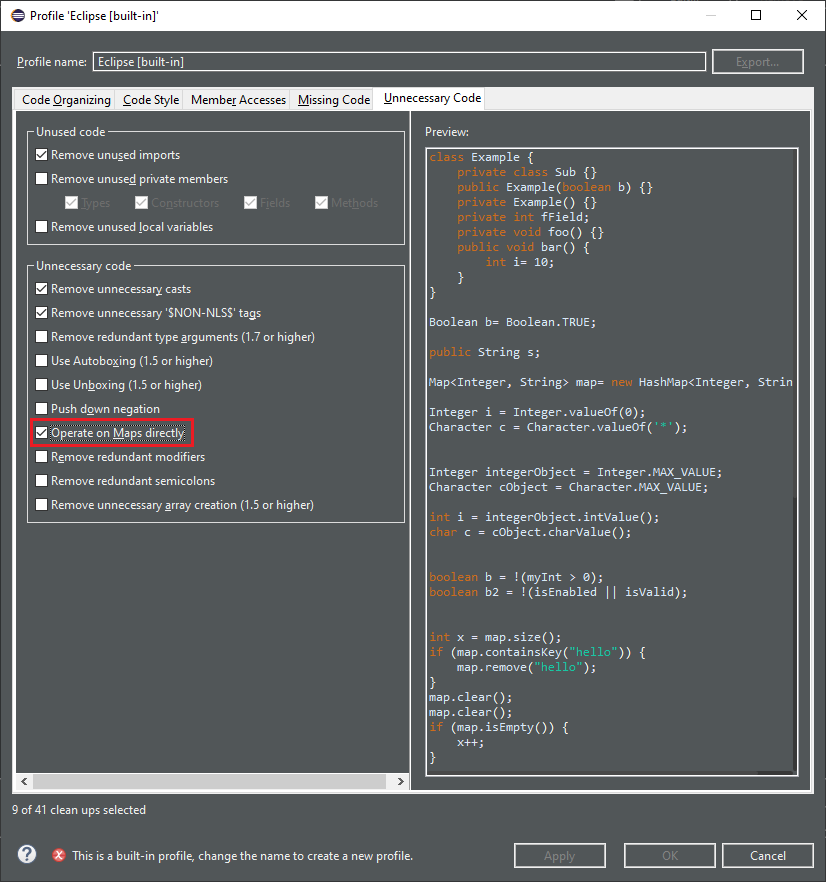
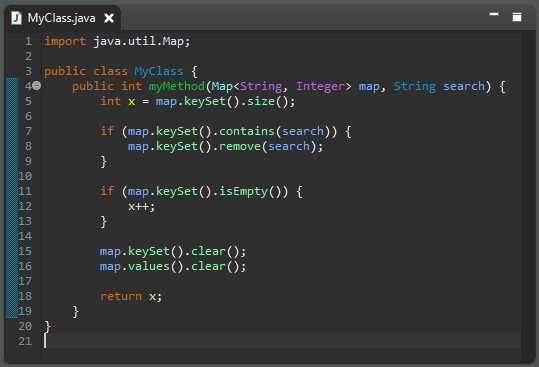
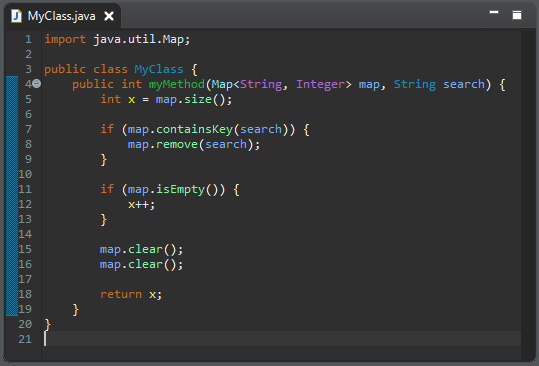
Some map manipulations are unnecessarily verbose. The new cleanup option Operate on Maps directly calls methods on a map instead of calling the same methods on the key set or the values.
Beware! If you create Map implementations that don’t follow the Map
specification,
this cleanup may break the behavior (a size()
method that changes the values,
an iterator that destroys the items…).
For the given code:
You get this after the clean up:
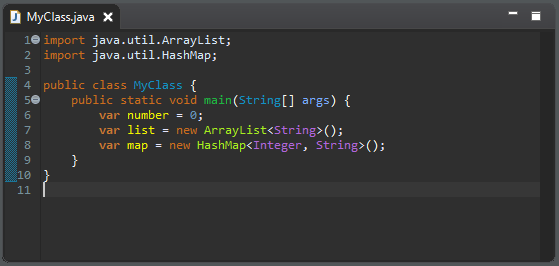
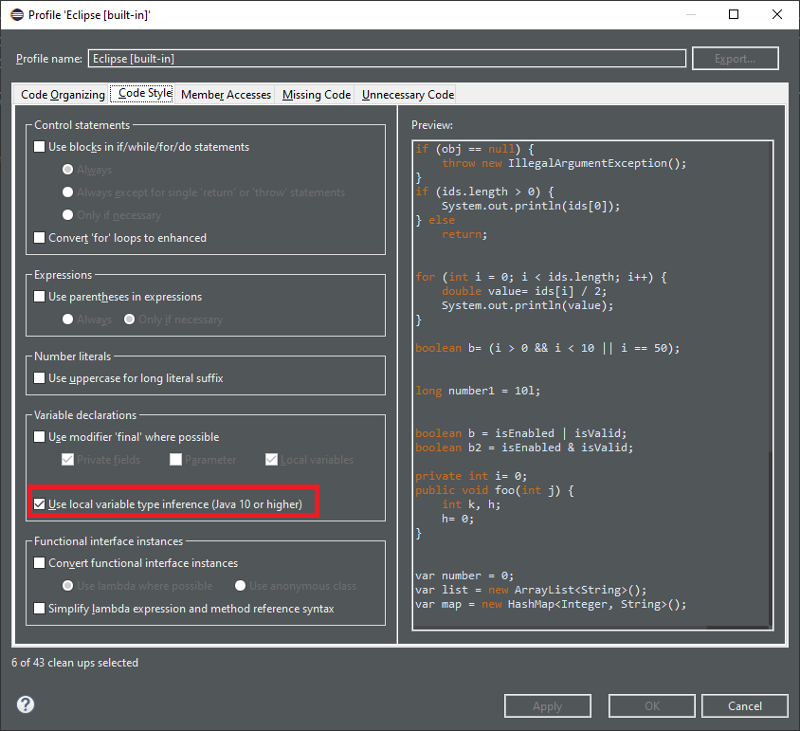
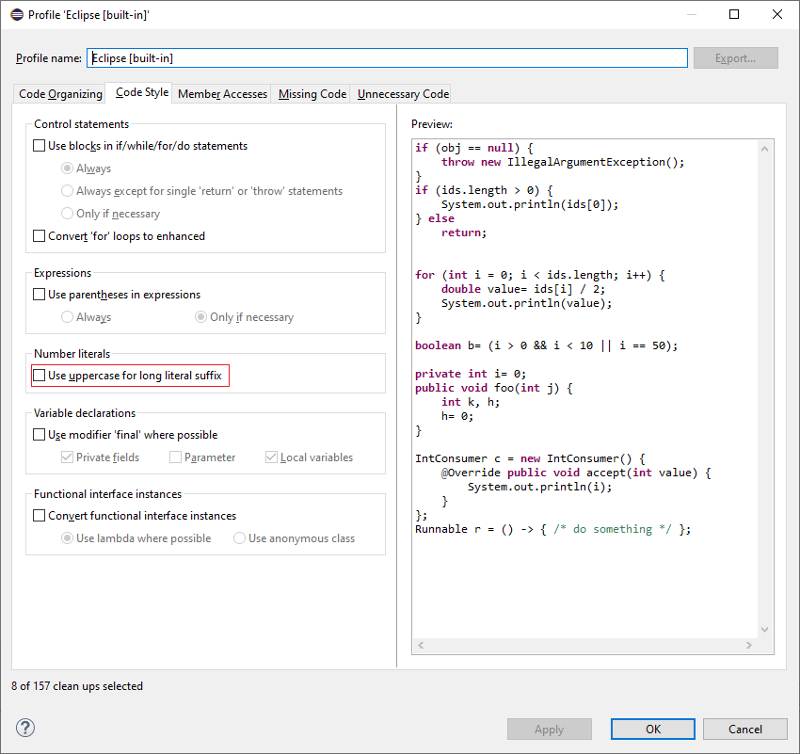
A new cleanup option Use uppercase for long literal suffix has been added. It will rewrite
long literals like 101l
with an uppercase L like 101L
to avoid ambiguity.
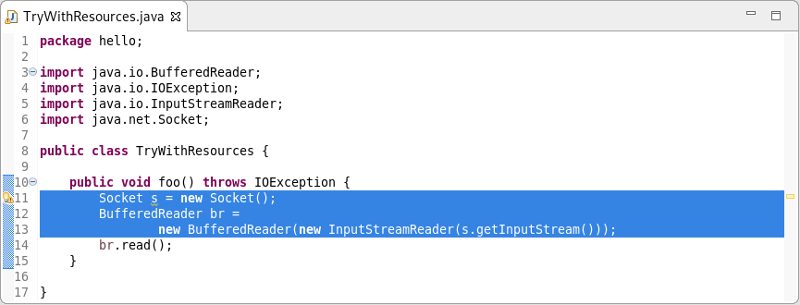
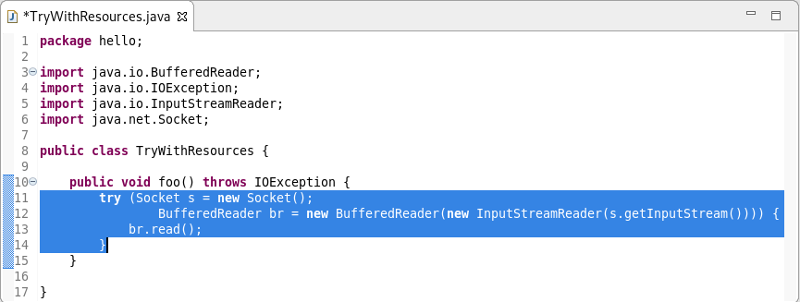
Corresponding to the quick fix which will surround a selection with a "try-with-resources" block, a new action has been added to the Surround With menu.
For example, selecting the lines as shown:
and right-clicking and selecting Surround With → Try-with-resources Block
results in:
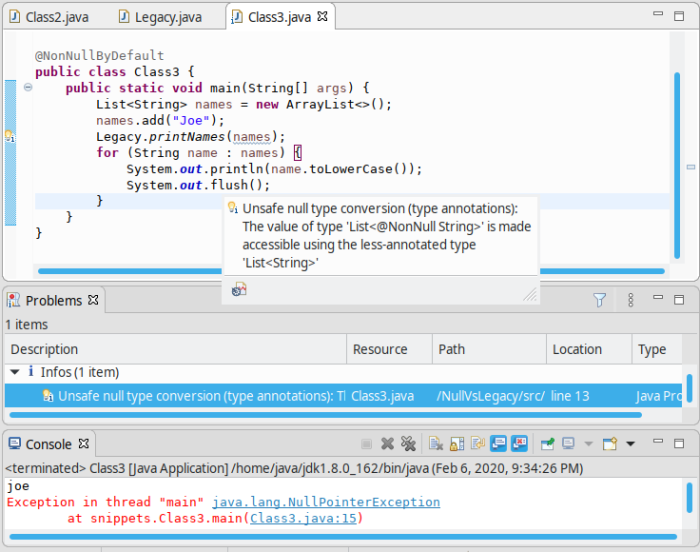
When using null-annotations for advanced null analysis, it is inherently tricky to combine your code with "legacy" code that has no null annotations and has not been blessed by such analysis.
Previously, Eclipse would only warn you when you obtain a dubious value from a legacy API, but it would keep silent in the opposite case: passing a value of an annotated type into legacy API. Still in specific situations this can cause a NullPointerException to be thrown in your null-checked code:
The console shows an exception thrown from within your checked main method (see
the class-level @NonNullByDefault
). It also shows the new warning, which Eclipse
raises to alert you of this danger.
Hint: The shown code assumes the list names
to have type List<@NonNull String>
,
but the legacy method Legacy.printNames()
succeeds to taint this list by inserting
a null
element. This goes unnoticed because that method views the list has having type
List<String>
, with no nullness constraint on the type argument.
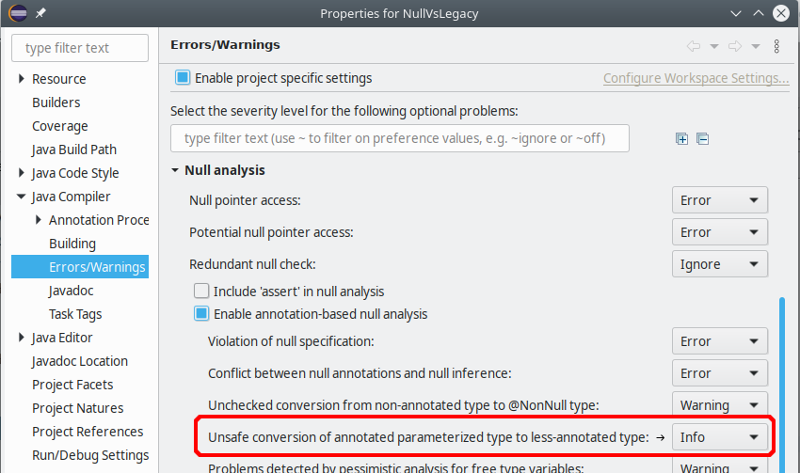
By default this problem is raised at level info
, but the severity can be configured in the compiler settings:
Resource leak analysis has been improved in several ways.
Most importantly, the analysis now consistently considers resources (=values of type
AutoCloseable
) which are acquired using a method call, where previously under
some circumstances resource allocation got unnoticed if it was wrapped in a factory
method, like in the following example:
makePrintWriter("/tmp/log.txt").printf("%d", 42);
// a PrintWriter is never closed!
Second, resource leak analysis now leverages knowledge about well-known resource classes
that support fluent programming, i.e., instance methods which return this
to enable
chains of method calls. Where a naive analysis could consider the method result
as a new resource coming into scope, special knowledge about these classes informs
the analysis that it is one and the same resource. This concerns the following
system classes:
CharArrayWriter, Console, PrintStream, PrintWriter, StringWriter, Writer
AsynchronousFileChannel, AsynchronousServerSocketChannel, FileChannel, NetworkChannel, SeekableByteChannel, SelectableChannel, Selector, ServerSocketChannel
Formatter
The following example is now understood to be safe, because analysis understands
that the resource returned by append()
is the same as the initial pw
:
PrintWriter pw = new PrintWriter("/tmp/log.txt");
pw.printf("%d", 42).append(" is the answer").close();
Generally, resource leak analysis was made more precise regarding several specific situations.
The Java formatter application will provide a sensible error message if a workspace is
required but not provided (-data
command line option). This also enables the -help
option to be run on the formatter without a workspace specified.
A new bundle services the org.eclipse.jdt.core.JavaCodeFormatter
application.
This new bundle is part of the JDT feature. Users who are not using the JDT feature to
define their set of bundles will need to add
org.eclipse.jdt.core.formatterapp
to their set of bundles.
You can find more noteworthy updates in on this page.
Happy to announce 4.15.0.AM1 (Developer Milestone 1) build for Eclipse 2020-03.
Downloads available at JBoss Tools 4.15.0 AM1.
Full info is at this page. Some highlights are below.
Please note that a regression has been found in the Fuse Tools. This is going to be fixed for the release (4.15.0.Final). Please find more information in this ticket.
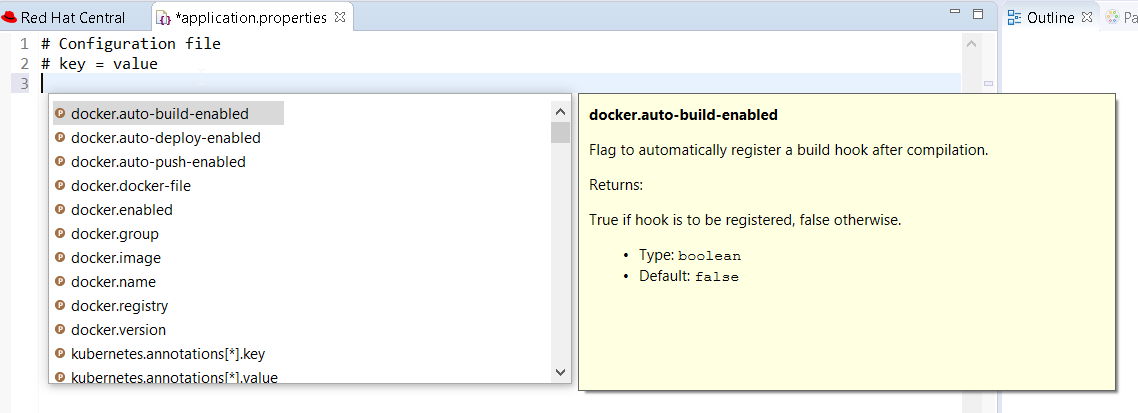
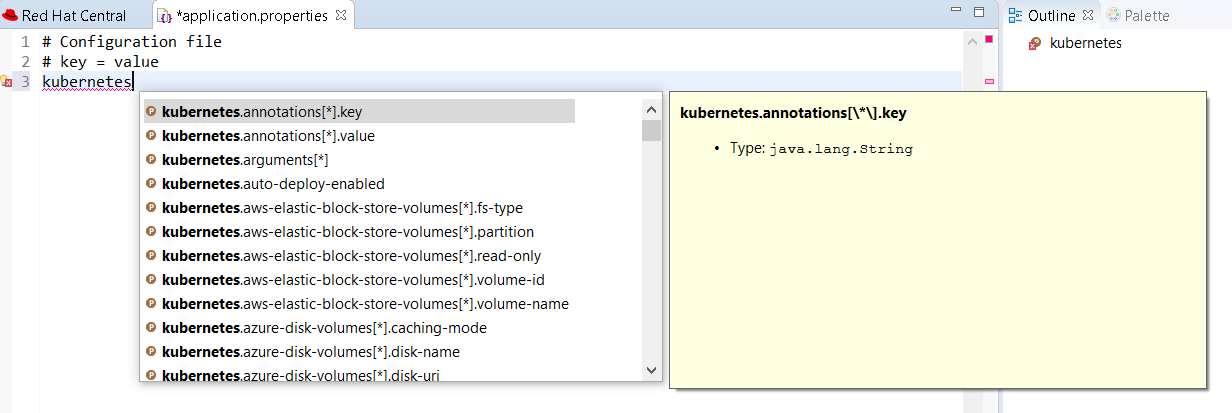
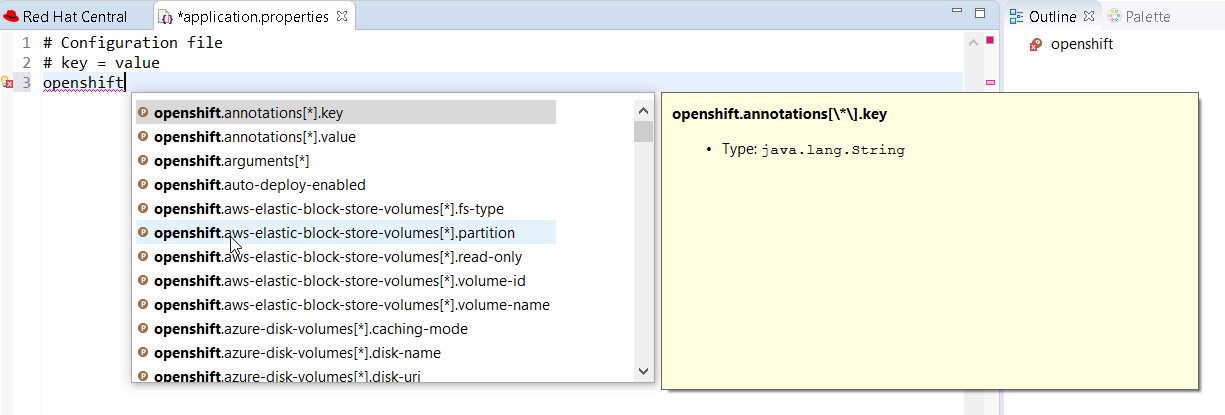
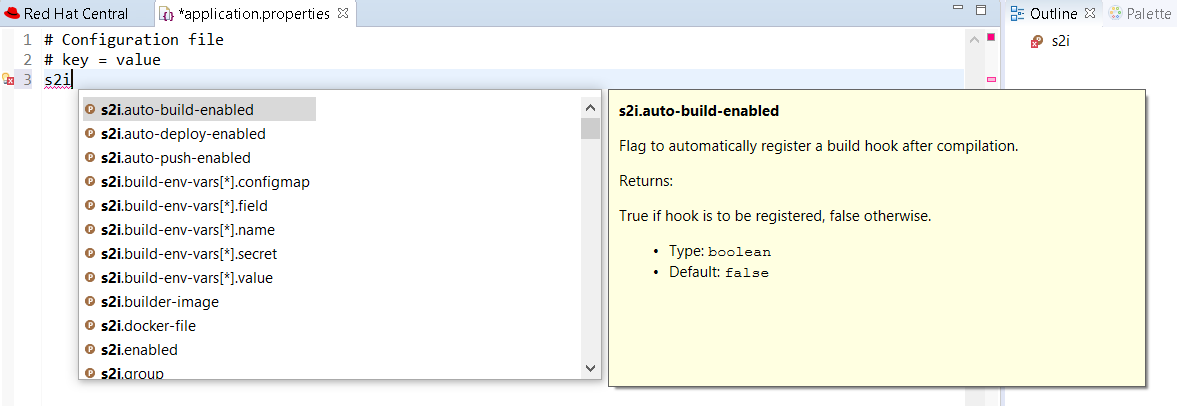
There is now completion, hover, documentation and validation for kubernetes., openshift., s2i., docker. properties
Enter kubernetes
prefix:
Enter openshift
prefix:
Enter s2i
prefix:
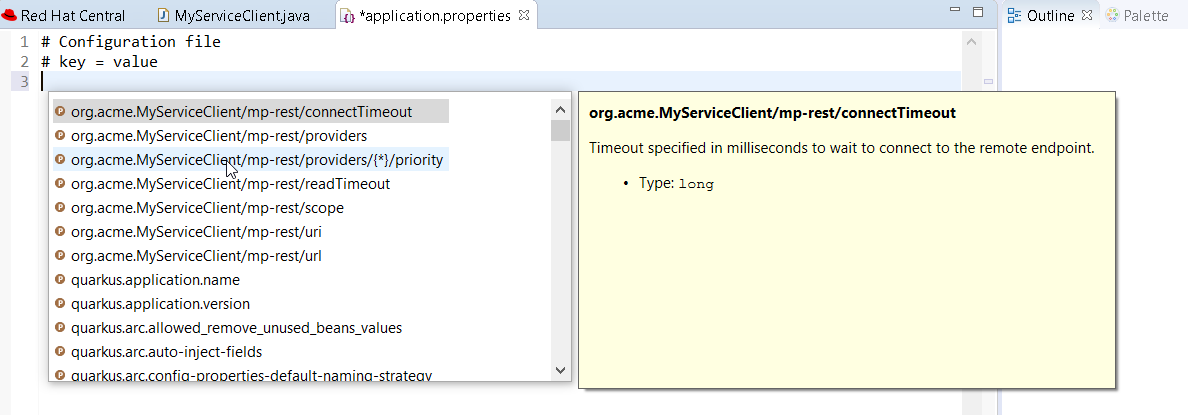
Likewise, there is now completion, hover, documentation and validation for the MicroProfile properties from REST Client.
After registering a REST client using @RegisterRestClient
like so:
package org.acme;
import javax.ws.rs.GET;
import javax.ws.rs.Path;
import javax.ws.rs.core.Response;
import org.eclipse.microprofile.rest.client.inject.RegisterRestClient;
@RegisterRestClient
public interface MyServiceClient {
@GET
@Path("/greet")
Response greet();
}
The related MicroProfile Rest config properties will have language feature support (completion, hover, validation, etc.).
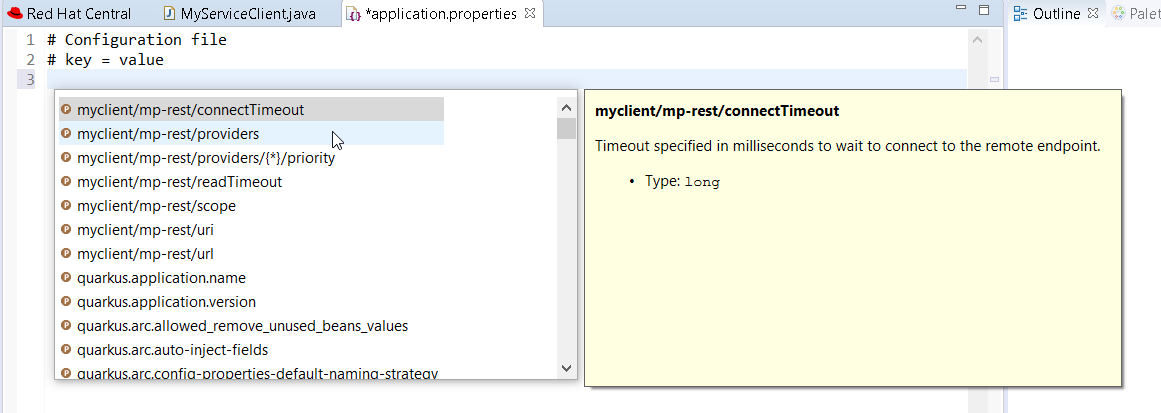
Change the Java code so that the configuration key is changed:
package org.acme;
import javax.ws.rs.GET;
import javax.ws.rs.Path;
import javax.ws.rs.core.Response;
import org.eclipse.microprofile.rest.client.inject.RegisterRestClient;
@RegisterRestClient(configKey = "myclient")
public interface MyServiceClient {
@GET
@Path("/greet")
Response greet();
}
and notice the code assist is changed accordingly:
Likewise, there is now completion, hover, documentation and validation for the MicroProfile Health artifacts.
So if you have the following Health class:
package org.acme;
import org.eclipse.microprofile.health.Health;
@Health
public class MyHealth {
}
you will get a validation error (as the class does not implement the HealthCheck
interface:
Similarly, if you have a class that implements HealthCheck
but is not annotated with Health
, some workflow applies:
package org.acme;
import org.eclipse.microprofile.health.HealthCheck;
import org.eclipse.microprofile.health.HealthCheckResponse;
public class MyHealth implements HealthCheck {
@Override
public HealthCheckResponse call() {
// TODO Auto-generated method stub
return null;
}
}
you will get a validation error (as the class is not annotated with Health
interface:
As there are several ways to fix the problem, then several quick fixes are proposed.
A server adapter has been added to work with Wildfly 19. It adds support for Java EE 8, Jakarta EE 8 and Microprofile 3.3.
Please note that while creating a Wildfly 19 server adapter, you may get a warning. This is going to be fixed for the release.
Related JIRA: JBIDE-27092
JBoss Tools 4.14.0 and Red Hat CodeReady Studio 12.14 for Eclipse 2019-12 are here waiting for you. Check it out!
Red Hat CodeReady Studio comes with everything pre-bundled in its installer. Simply download it from our Red Hat CodeReady product page and run it like this:
java -jar codereadystudio-<installername>.jar
JBoss Tools or Bring-Your-Own-Eclipse (BYOE) CodeReady Studio require a bit more:
This release requires at least Eclipse 4.14 (2019-12) but we recommend using the latest Eclipse 4.14 2019-12 JEE Bundle since then you get most of the dependencies preinstalled.
Once you have installed Eclipse, you can either find us on the Eclipse Marketplace under "JBoss Tools" or "Red Hat CodeReady Studio".
For JBoss Tools, you can also use our update site directly.
http://download.jboss.org/jbosstools/photon/stable/updates/
Our main focus for this release was a new tooling for the Quarkus framework, improvements for container based development and bug fixing. Eclipse 2019-12 itself has a lot of new cool stuff but let me highlight just a few updates in both Eclipse 2019-12 and JBoss Tools plugins that I think are worth mentioning.
With the new OpenShift Container Platform (OCP) 4.3 now available (see this article), JBoss Tools is compatible with this major release in a transparent way. Just define your connection to your OCP 4.3 based cluster as you did before for an OCP 3 cluster, and use the tooling !
A new OpenShift Application Explorer window has been added in addition to the OpenShift Explorer. It is based on OpenShift Do. It provides a different and simplified user experience allowing easy and rapid feedback through inner loop and debugging.
Let’s see it in action.
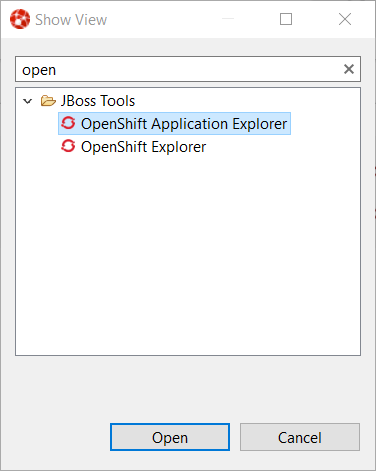
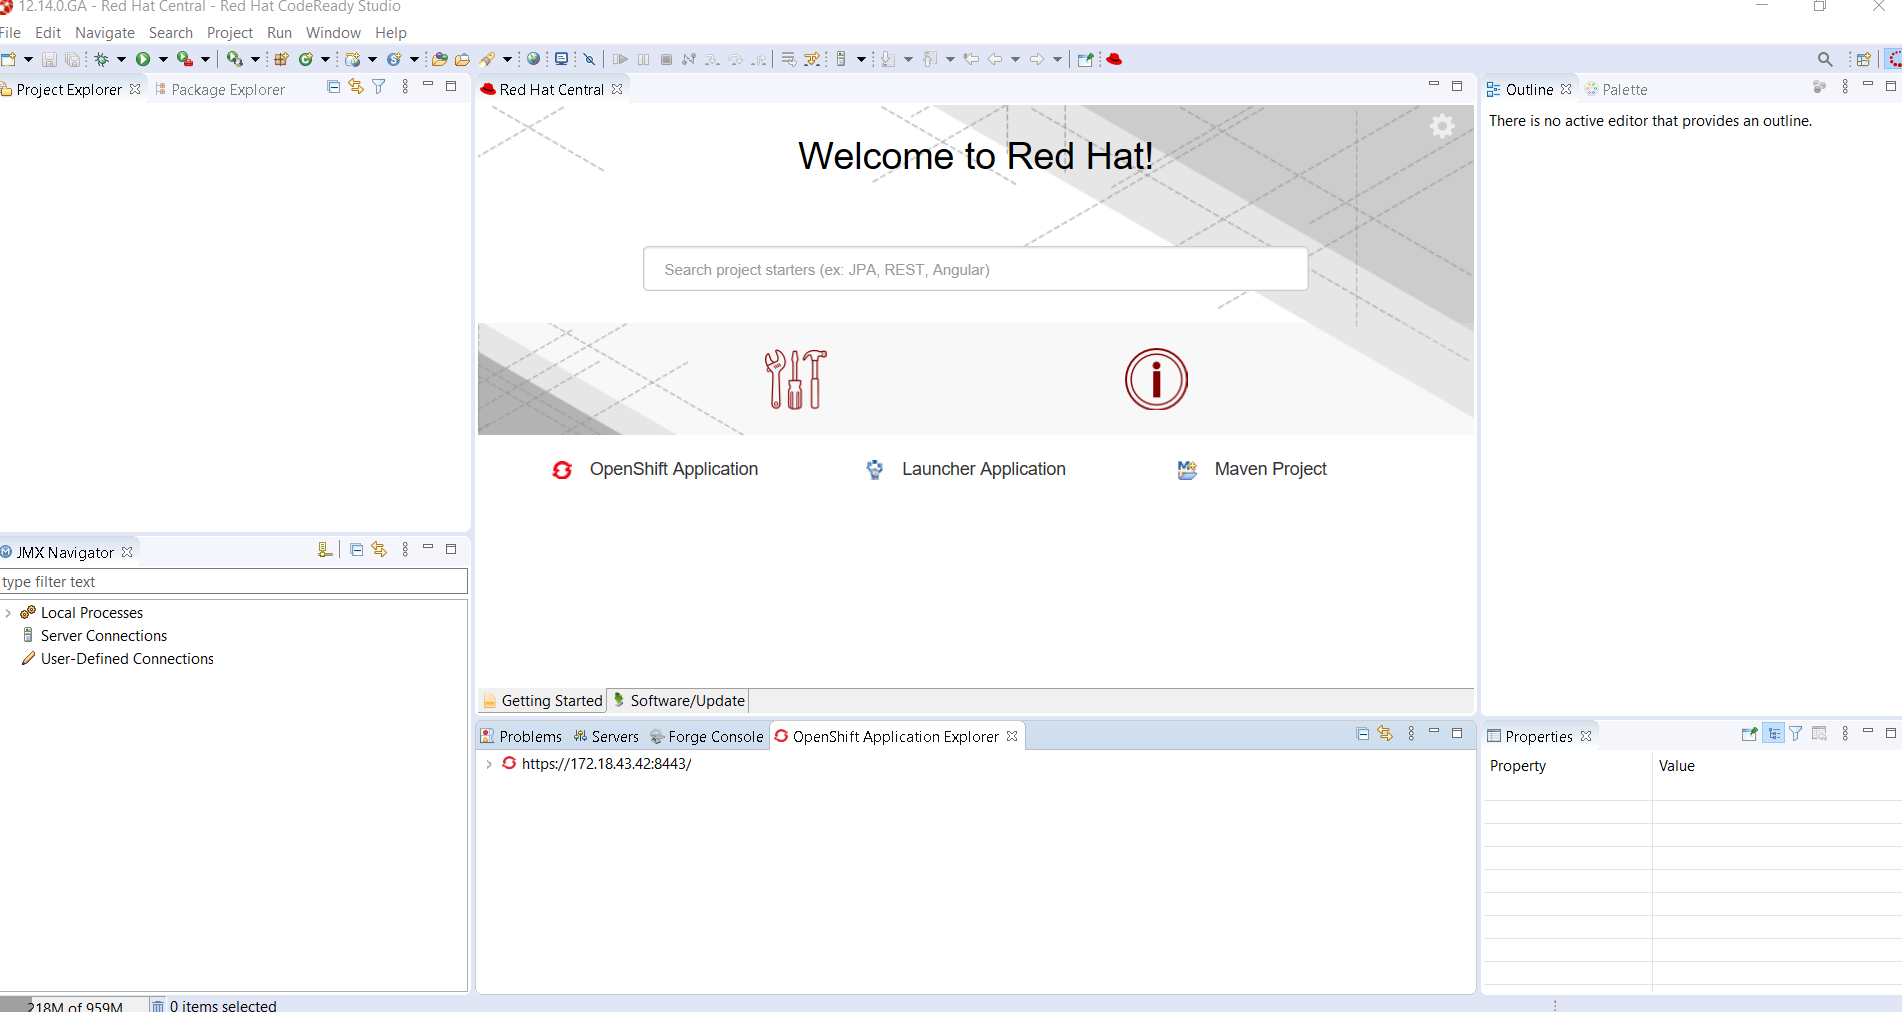
If you opened a brand new workspace, you should see the OpenShift Application Explorer view in the list of views available on the botton part of the screen:
If you don’t see the view being listed, you can open it
through the
menu,
enter Window -→ Show View -→ Other
in the filter text box and then select
open
:OpenShift Application Explorer
Expanding the root node will display the list of projects available on the cluster:
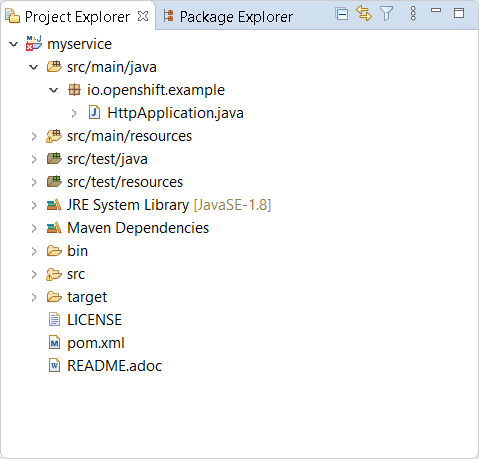
We will show how to deploy a Java based microservice and
how to use the various features. But we first need to load
the component source code in our workspace. Thanks to the
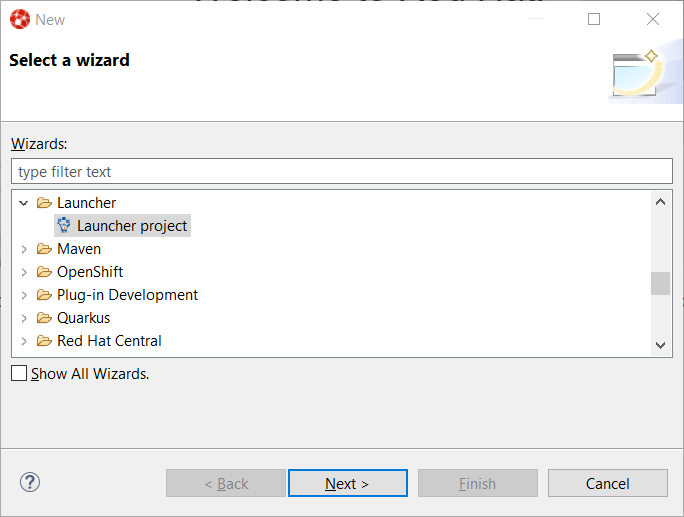
launcher wizard, we can do that easilly. Try
and select the Ctrl+N
wizard:Launcher project
Then click the
button:Next
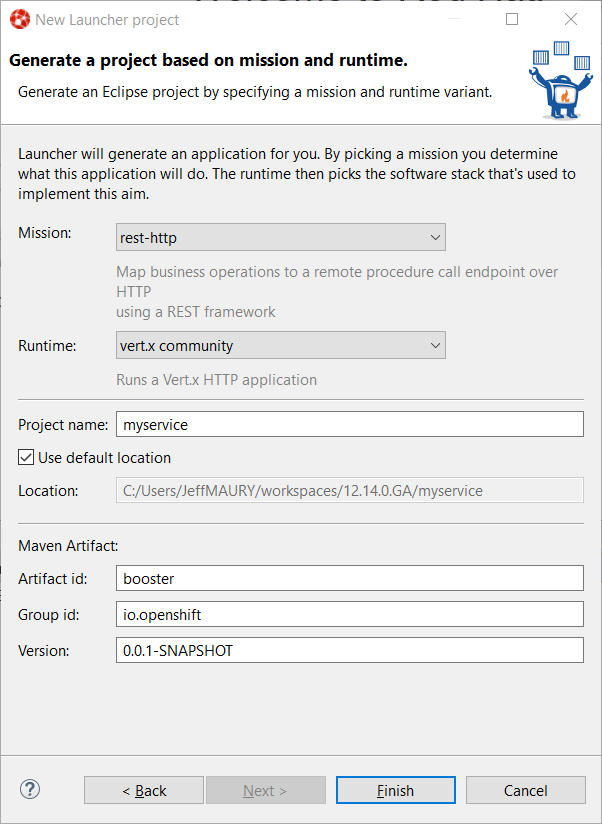
Select
in the rest-http
field,
Mission
in the vert.x community
field,
Runtime
in the myservice
field:Project name
Then click the
button: a new project will be
added to your workspace. Once the dependencies resolution
has been completed, we’re ready to start playing with the
cluster.Finish
Now that we have the source code, we can create the component. From the OpenShift Application Explorer view,
right select the project (myproject), and the click the
menu:New → Component
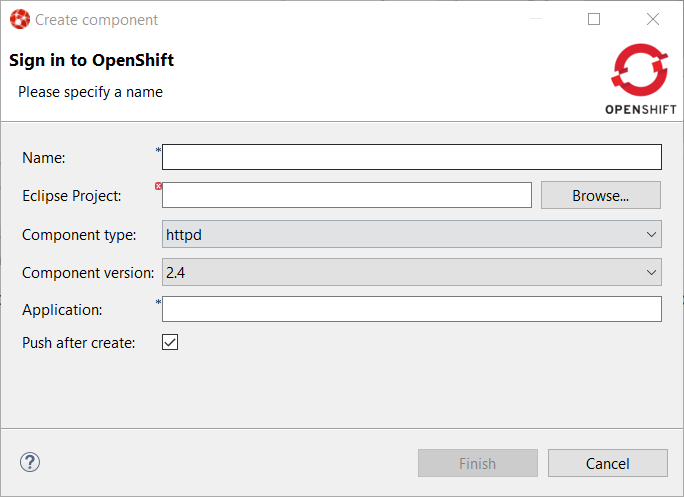
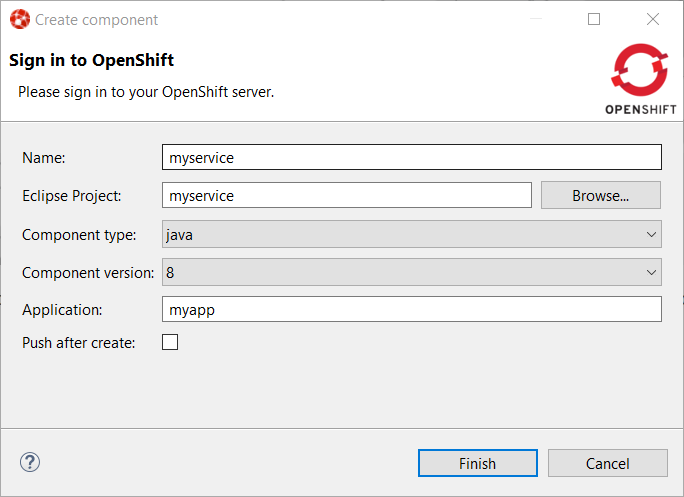
Enter
in the myservice
field, click the Name
button to select the project we have just created, select Browse
in the
java
field, select Component type
in the 8
field,
enter Component version
in the myapp
field and uncheck the
Application
check-box:Push after create
Then click the
button. The component will be created and expanding
the project node will now show the application that contains our component:Finish
Expanding the application will now display our component:
The component has been created but it is not yet deployed on the cluster (as we
unchecked the
check-box. In order to deploy it,right
select the component and click the Push after create
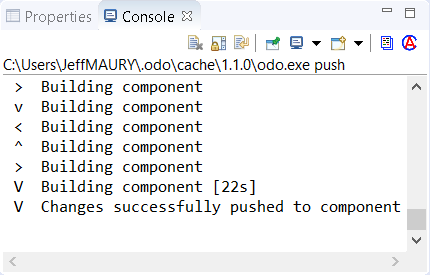
menu. The deployment will be
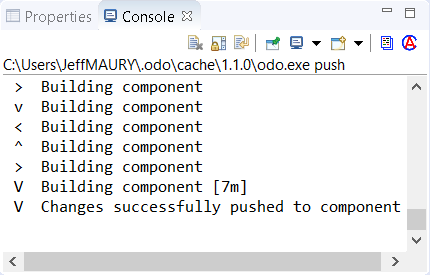
created and then a build will be launched. A new window will be created in the
Push
view. After a while, you should see the following output:Console
The component is now deployed to the cluster but we cannot access it as we need
to define an URL to access it externally. Right select the component and click
the
menu:New → URL
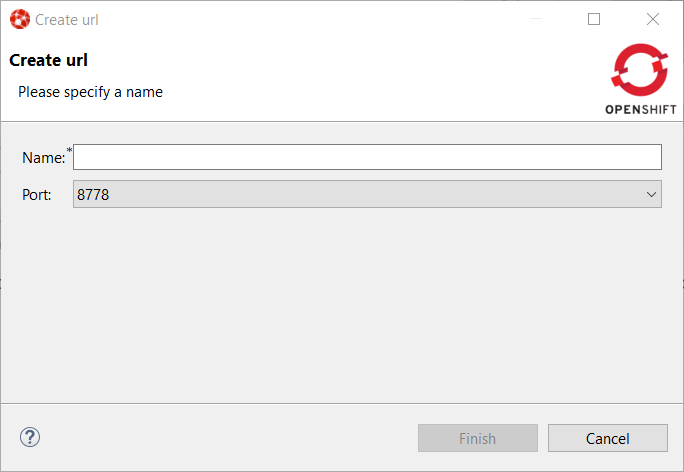
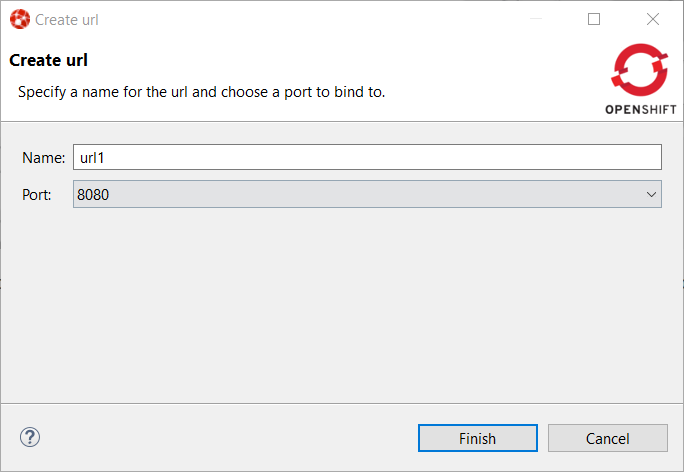
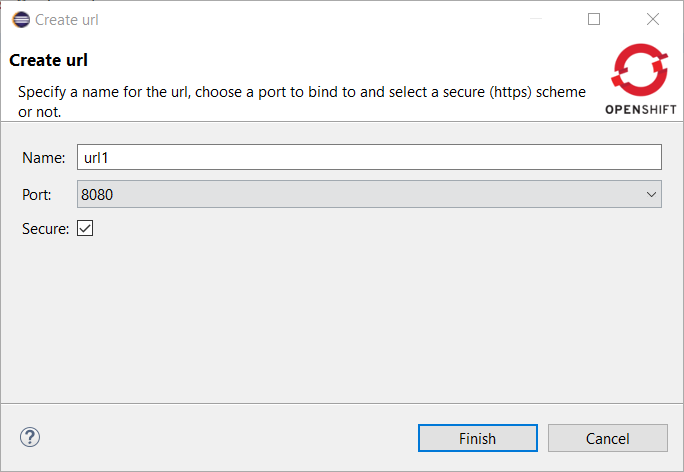
Enter
in the url1
field and select Name
in the 8080
field:Port
Then click on the
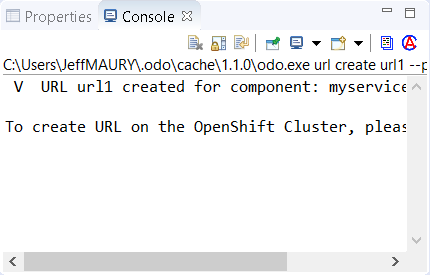
button. The URL is created but not on the cluster,
so we need to push again the component so that the local configuration is
synchronized with the configuration on the cluster. The Finish
window
will display a message claiming that a push is now required:Console
So push the component again (
).component → Push
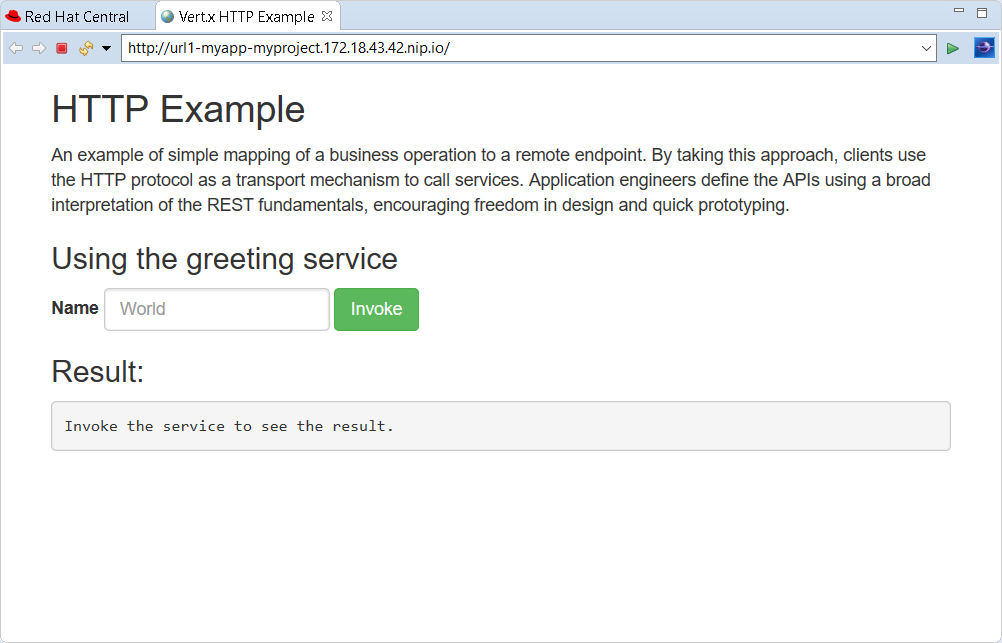
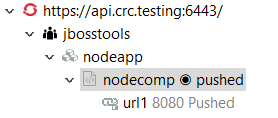
Let’s check that we can now access the service. Expand the component level so that we can see the URL we have just created:
Right select the URL and click the
menu, you should see the new browser window:Open in Browser
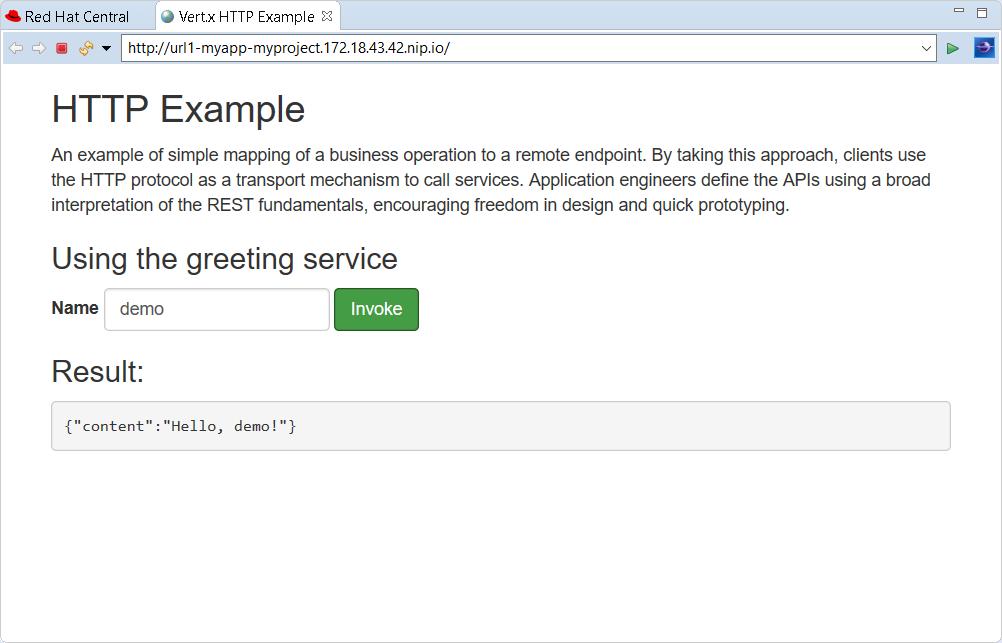
You can test the service: enter
in the text box and click the
demo
button:Invoke
We will now see how we can get fast feedback on code changes. So let’s modify the application code and see how we can synchronize the changes to the cluster.
In the
view, locate the Project Explorer
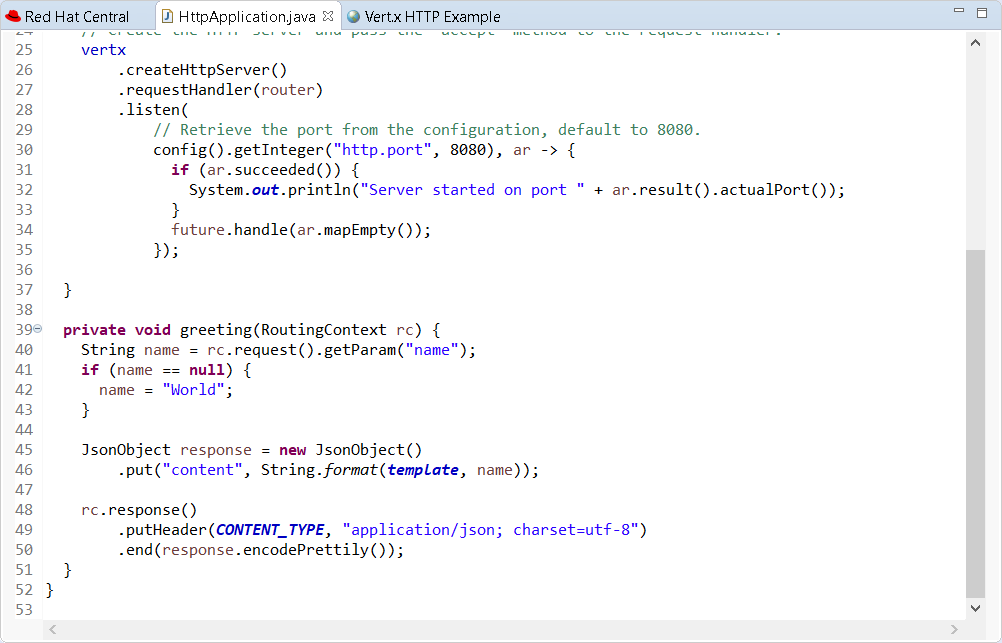
file:HttpApplication.java
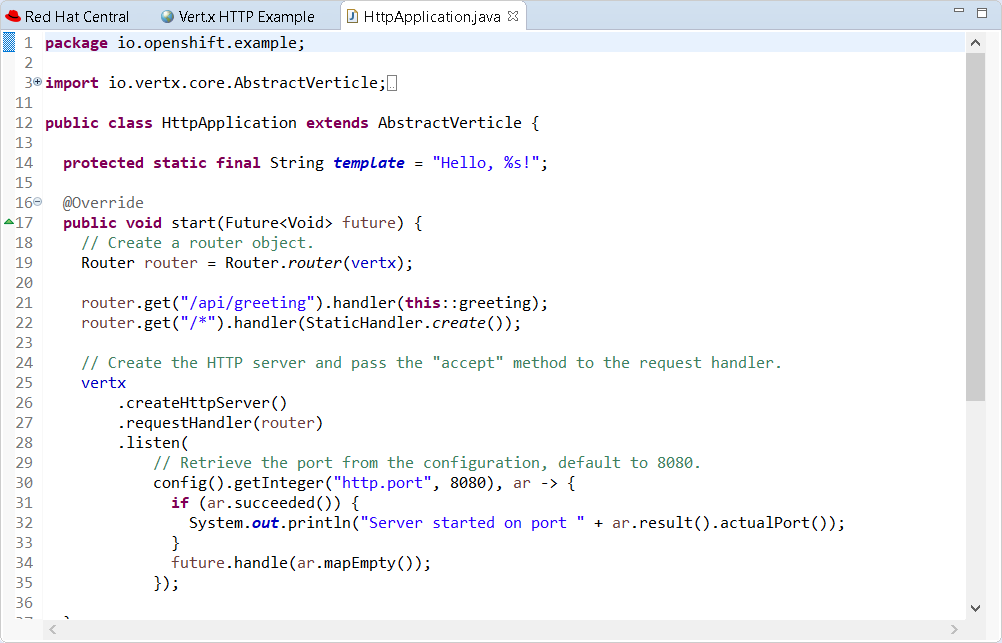
Double click on the file to open the editor:
On line 14, change the line:
protected static final String template = "Hello, %s!";
to
protected static final String template = "Hello, %s!, we modified the code";
and press the
key in order to save the file.Ctrl+S
For the OpenShift Application Explorer, right click the component (myservice) and
click the
menu to send the changes to the cluster: the component will be
built again on the cluster with the next changes and after a few seconds, it will be
available again:Push
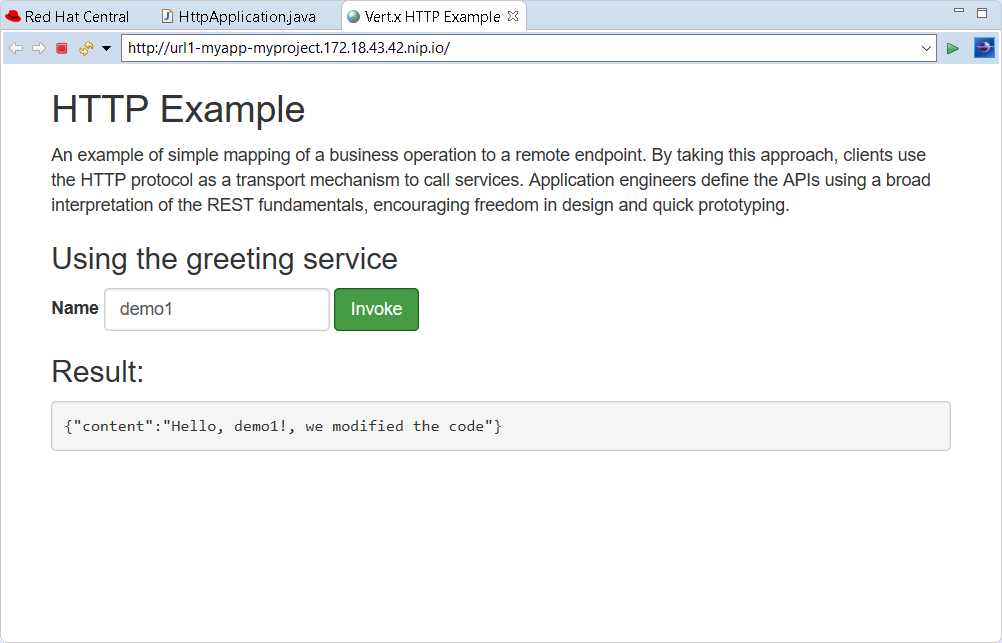
Select the browser window again, enter
in the textbox (we need to change
the value we used before in order to make sure cache is not involved) and click the
demo1
button again:Invoke
We’ve seen that, through a sequence of code modification(s) followed by a synchronize
action (push) to the cluster, we can get a very fast feedback. If you don’t want to
manually synchronize the the cluster (push), you can opt to automatically synchronize
to the cluster with the
action: each time a code modification is done locally
on your workstation, a new build will be automatically launched on the cluster.Watch
Testing an application through code changes is a great achievement so far but it may be difficult for complex applications where we need to understand how the code behaves without the need to use the UI. That’s why the next step is to be able to debug our application live on the cluster.
The new OpenShift Application Explorer allow such a scenario. We will first set up a breakpoint
in our application code. Select again the
file and scroll
down to the HttpApplication.java
method:greeting
On line 41, double click in the left ruler column so that a breakpoint is set:
We are now ready to debug our application. In order to do that, we need to launch
a local (Java in our case) debugger that will be connected to our application on the
cluster. This is what the
action is doing: right select the component
(myservice) and click the Debug
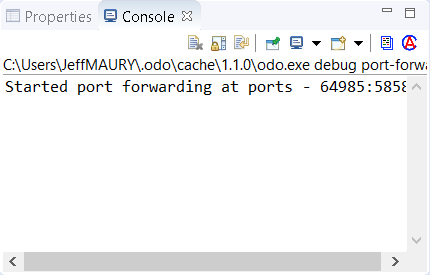
menu: you will see that port forwarding has been
started so that our local (Java) debugger can connect to the remote Java virtual
machine:Debug
and then a local (Java) debugger is launched and connected to that port. Let’s check now that we can debug our application:
Select the browser window again, enter
in the textbox (we need to change
the value we used before in order to make sure cache is not involved) and click the
demo2
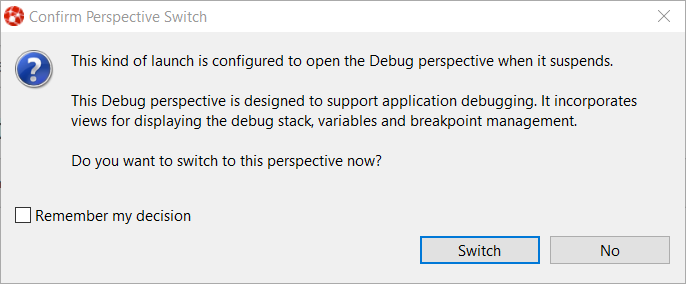
button again: as our breakpoint is hit, you will be asked if you want to
switch to the Invoke
perspective (this may not be displayed if you previously
selected the Debug
checkbox:Remember my decision
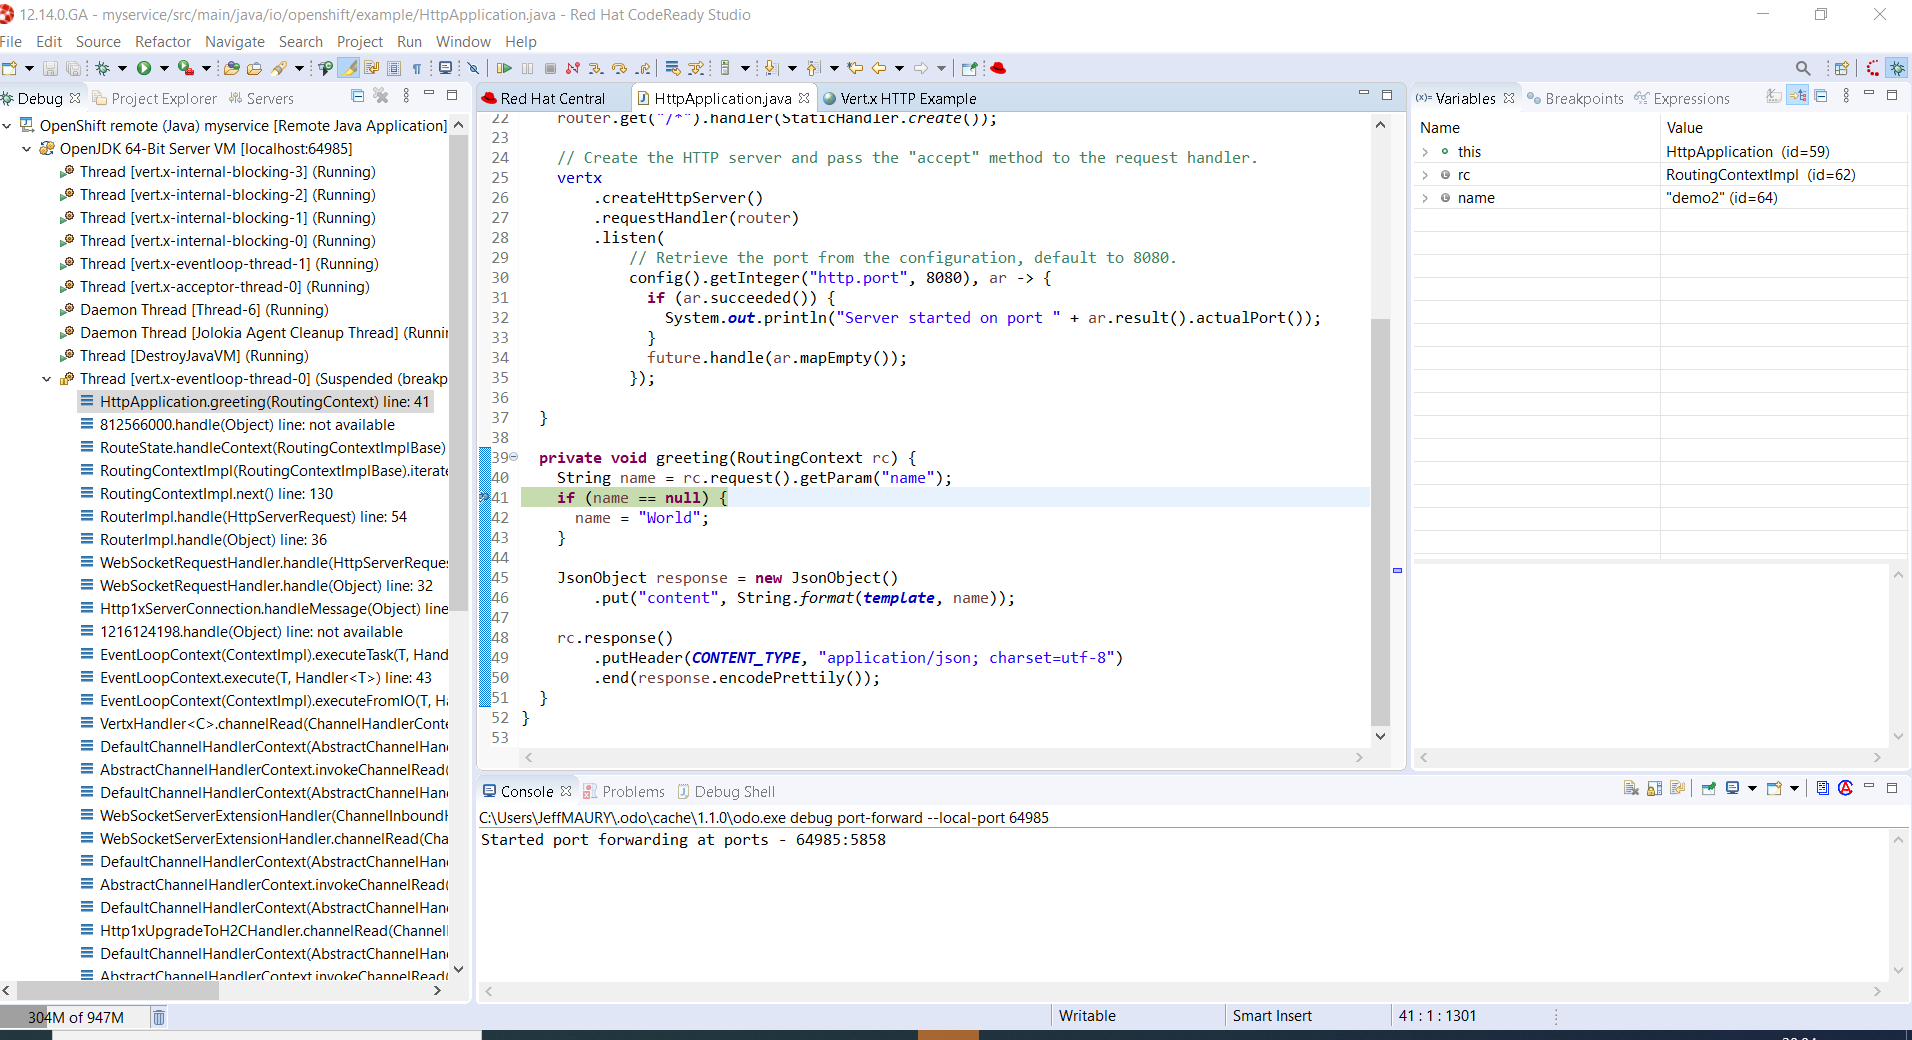
Click the
button and you will see the Switch
perspective:Debug
You are now debugging a Java component running on a remote cluster just like it was running locally on your workstation. Please note that we demoed this feature using a Java based component but we also support the same feature to NodeJS based components.
Starting with this release, we’ve added a new Quarkus tooling for applications built on top of the Supersonic Subatomic Java Quarkus framework.
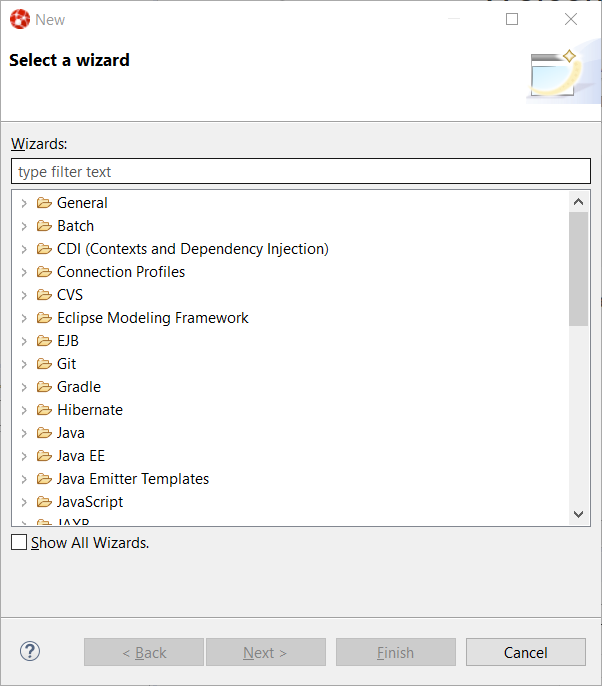
A new wizard has been added to create a new Quarkus application project in your workspace. In order to launch it, first enter Ctrl+N to get the list of available wizards
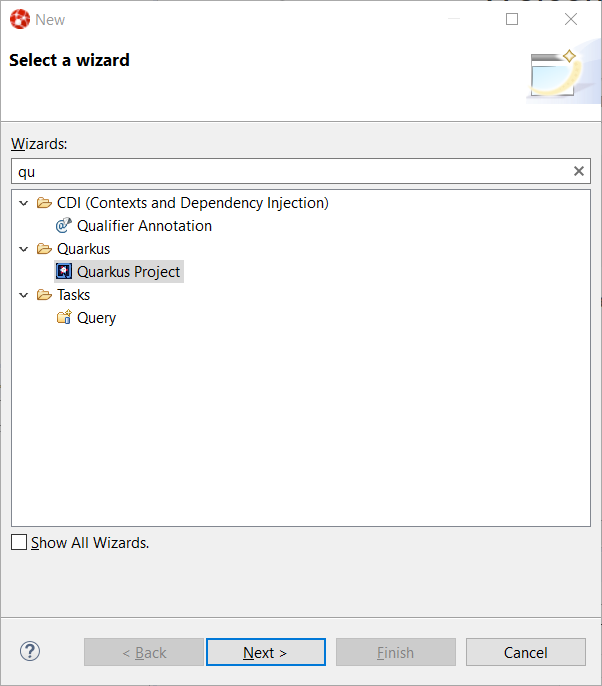
In the filter text box, enter the
characters to filter the list of wizards:qu
Select the Quarkus Project wizard and click the Next button:
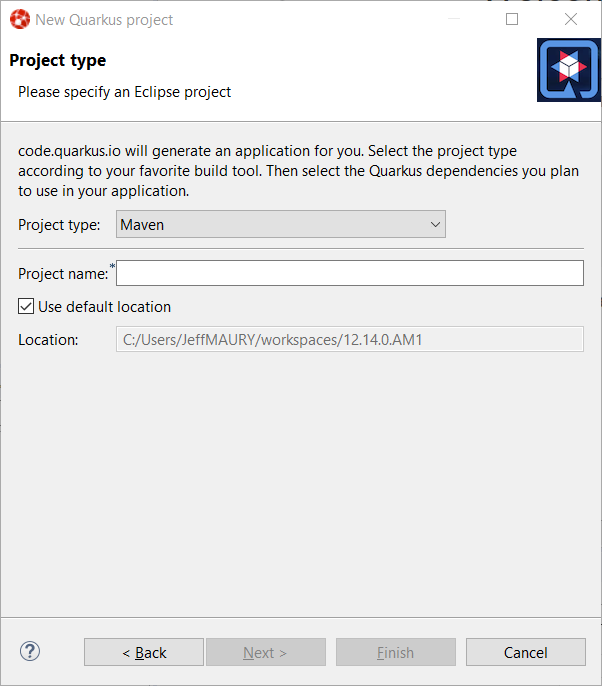
The Project type combo allows you to choose between Maven or Gradle tool used to manage your project. We’ll go with Maven for this tutorial.
Enter a project name (we will use code-with-quarkus) and click the Next button:
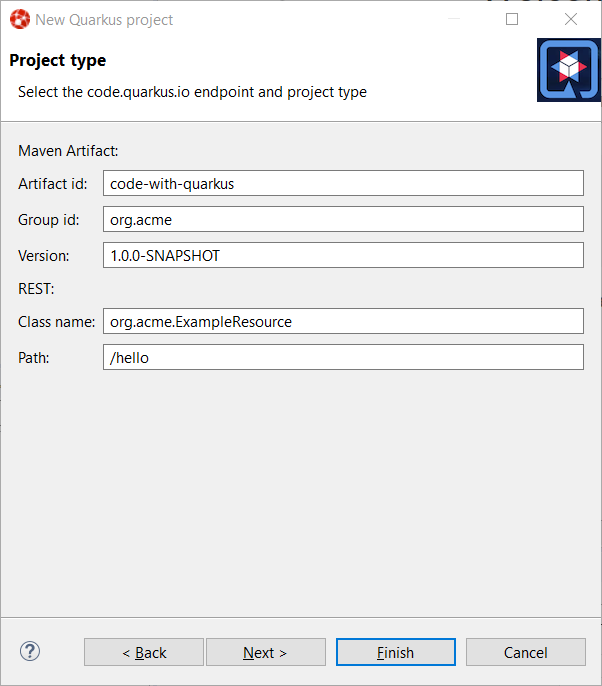
This dialog allows you to choose various parameters for you project, like the project coordinates (group id, artifact id and version) along with the base REST endpoint information. We’ll use the default so click on the Next button:
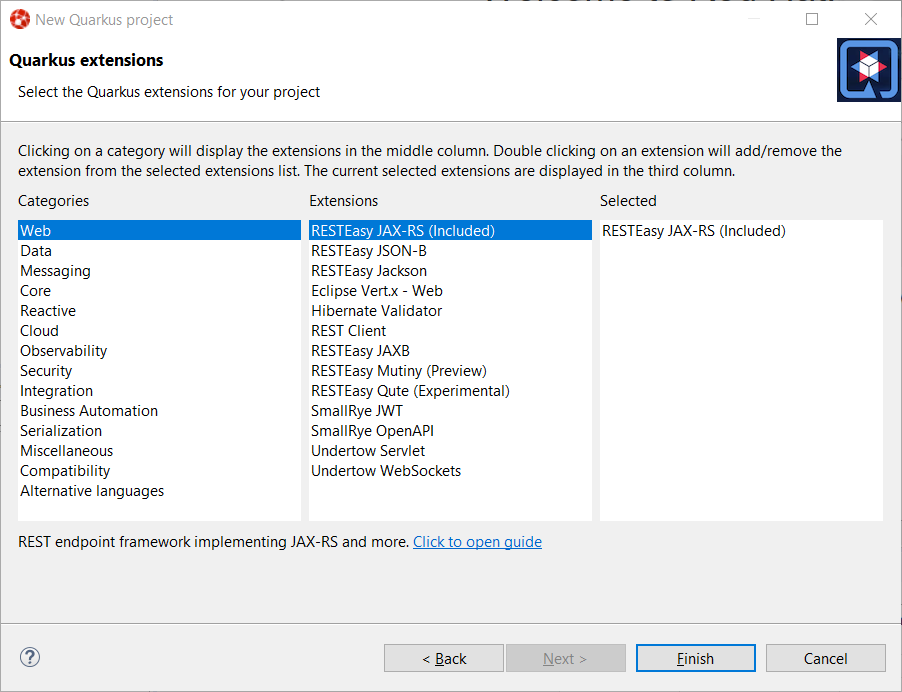
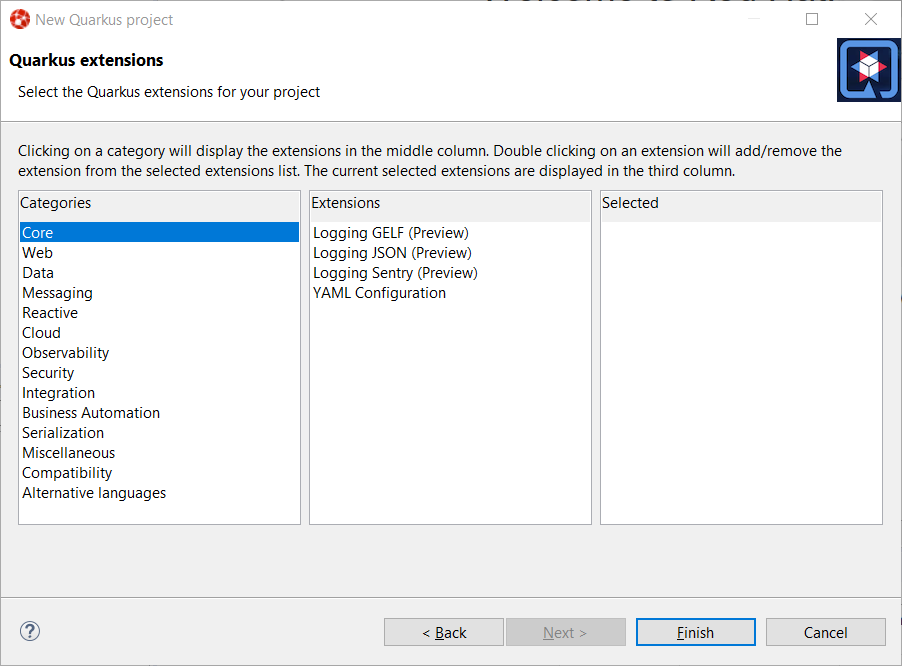
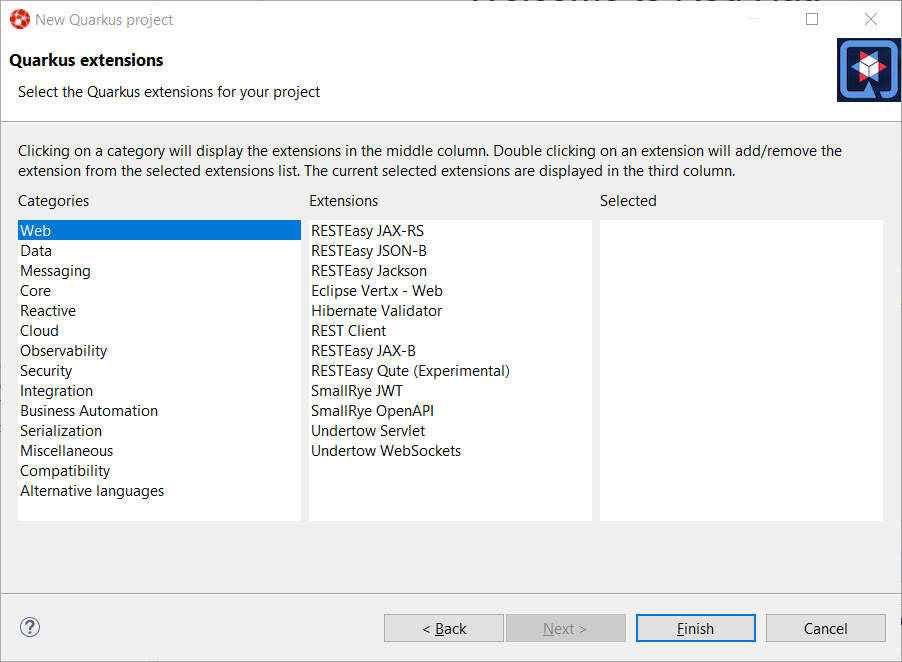
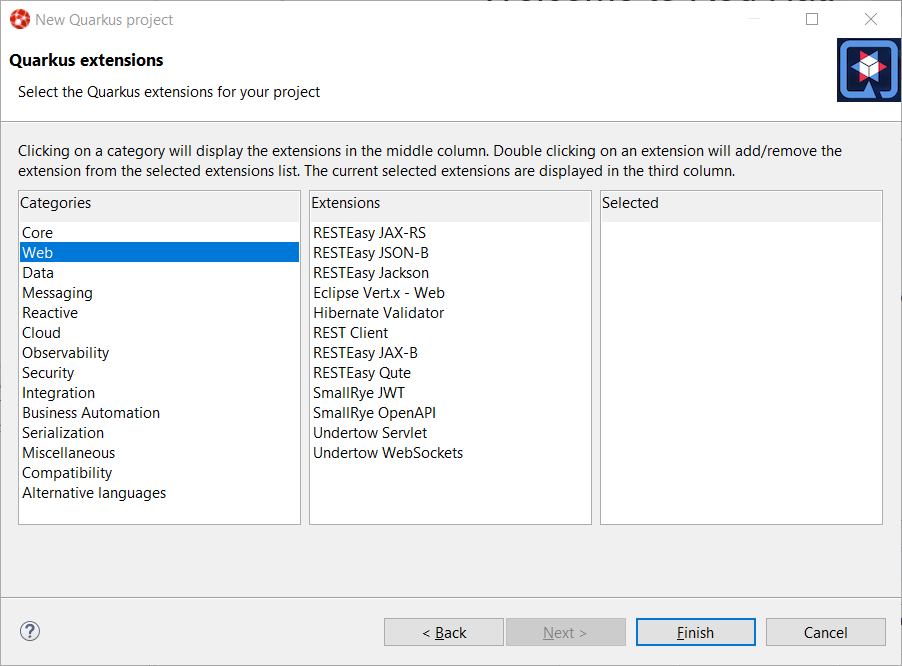
This dialog allows to select which Quarkus extensions you want to add to your project. The extensions are grouped by categories, so first select a specific category in the left table. We will choose the Web one:
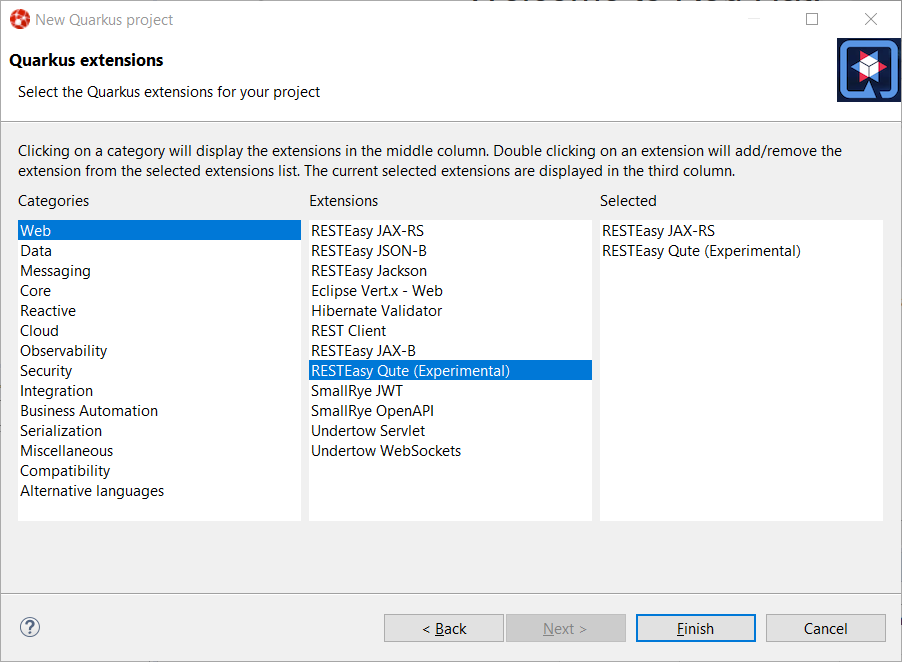
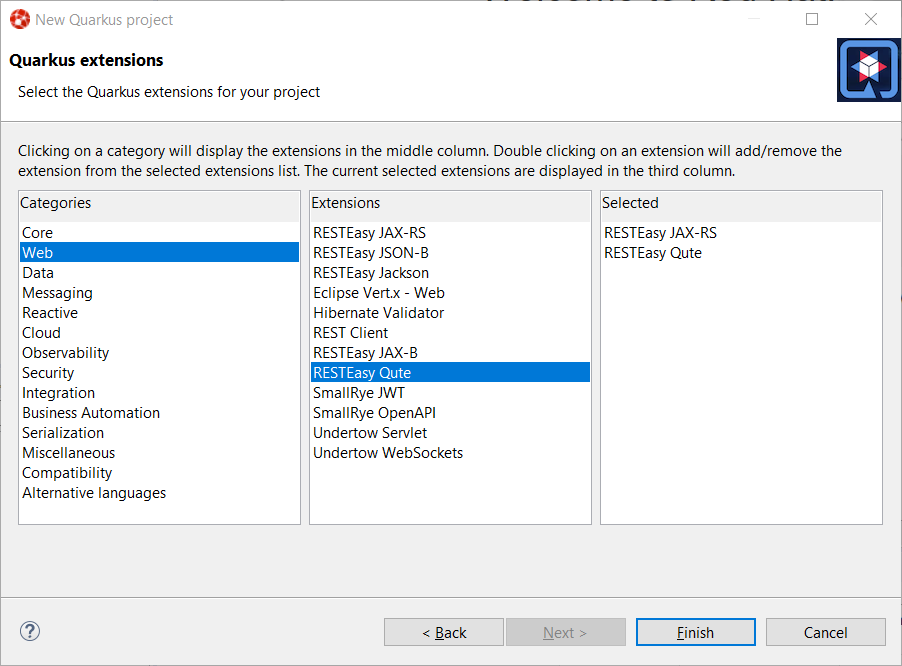
You should have noticed that the middle table has been updated. In order to add an extension, double click on the extension in the middle table. We will add RESTEasy JAX-RS and RESTEasy Qute (a templating engine):
You should have noticed that the extensions that you double clicked on are now being added to the right table. If you want to remove an extension from the list of selected ones, double click again either in the center table or in the right table.
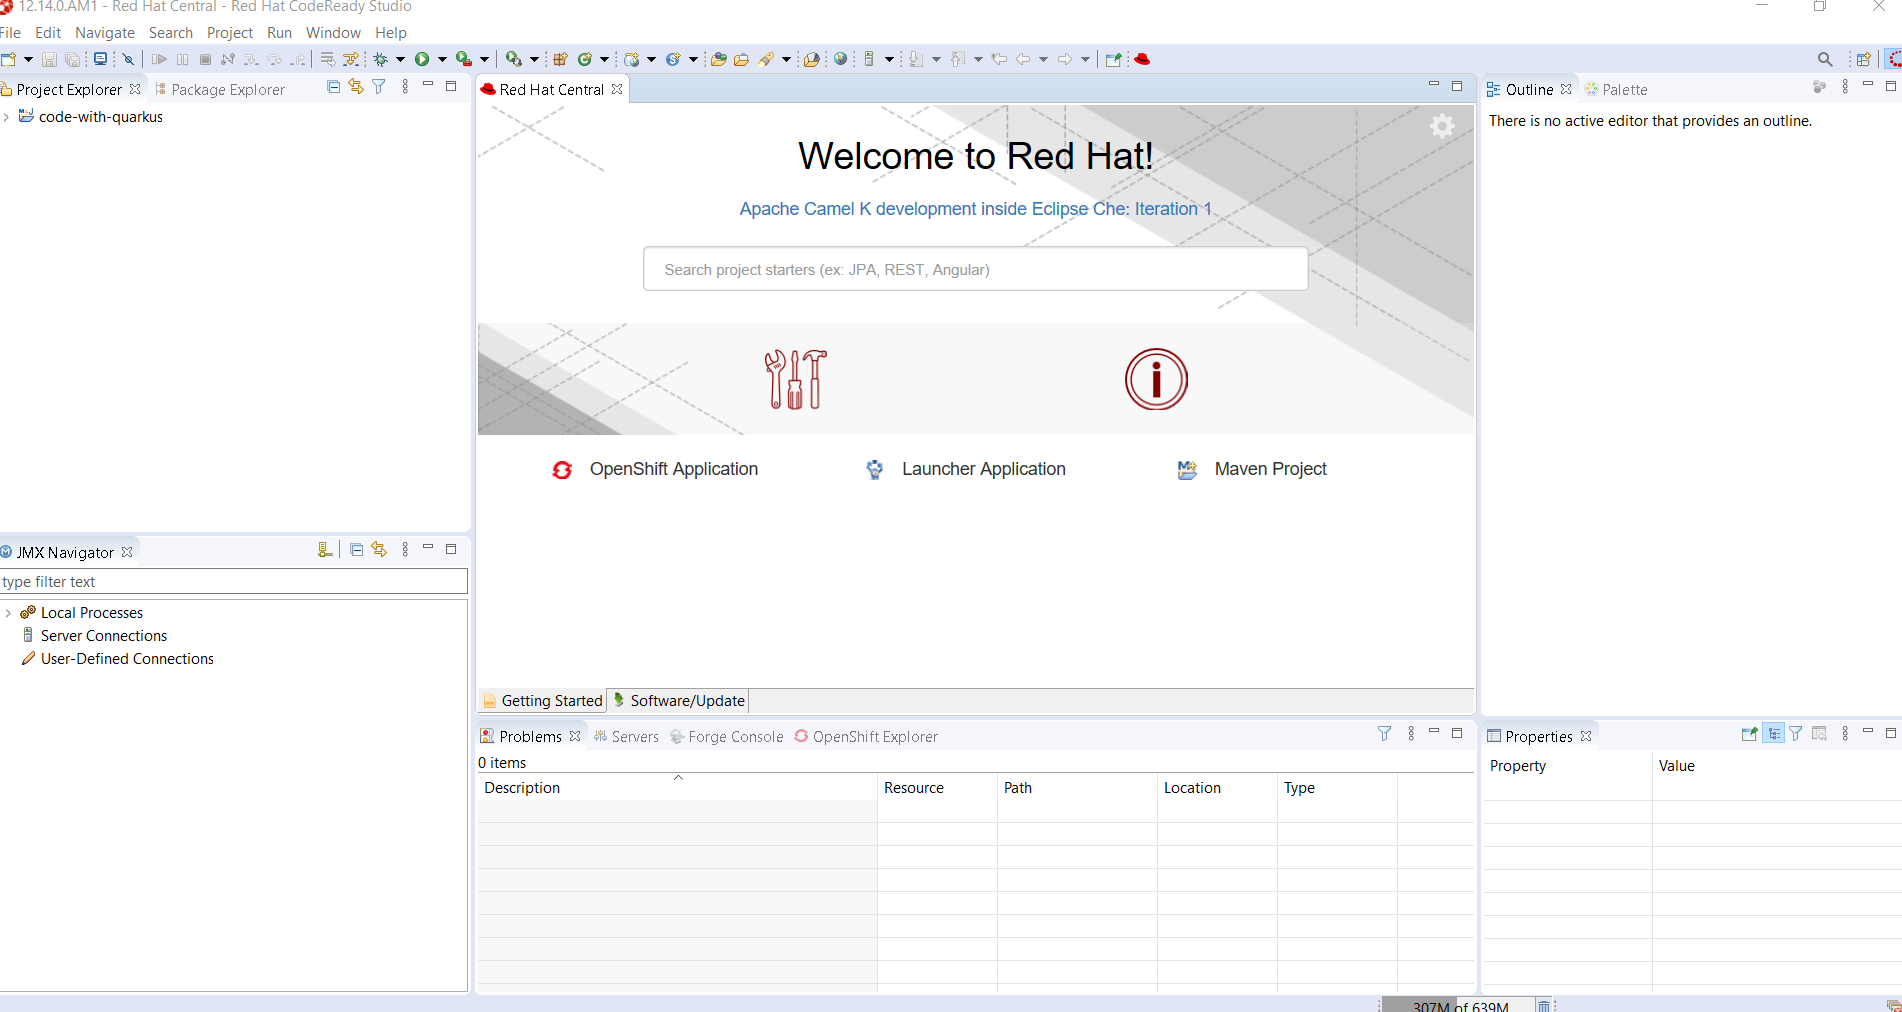
We are now all set so click on the Finish button to launch the project creation. The project creation job is then launched, dependencies are being retrieved and after a while, the new project will appear in the Project Explorer window:
We have successfully created our first Quarkus project. Let’s see now how we can launch this application and debug it.
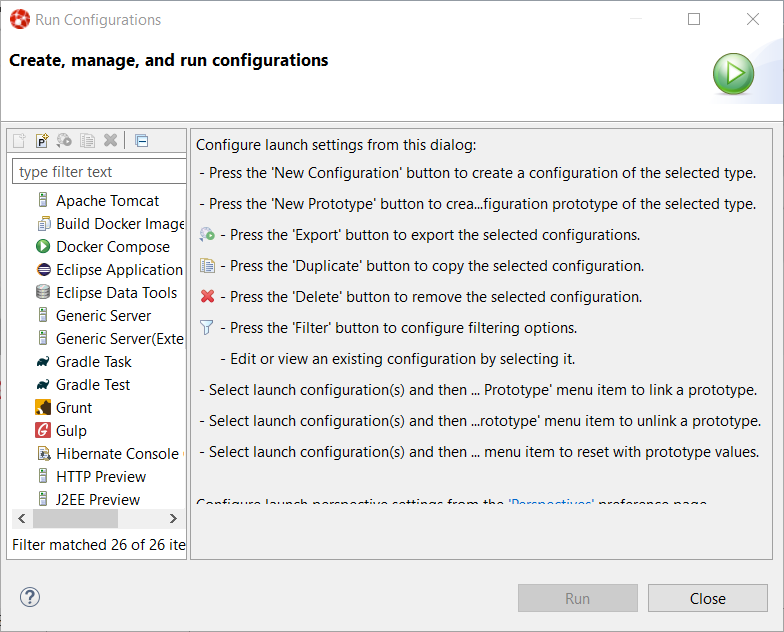
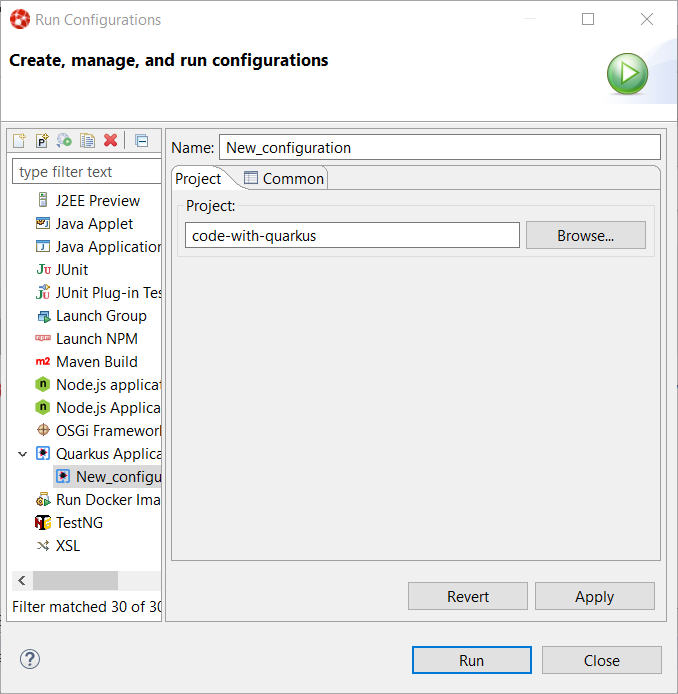
Running a Quarkus application can be done from the workbench Run configurations. Select the Run → Run Configurations… menu to display the dialog allowing to create a Run configuration.
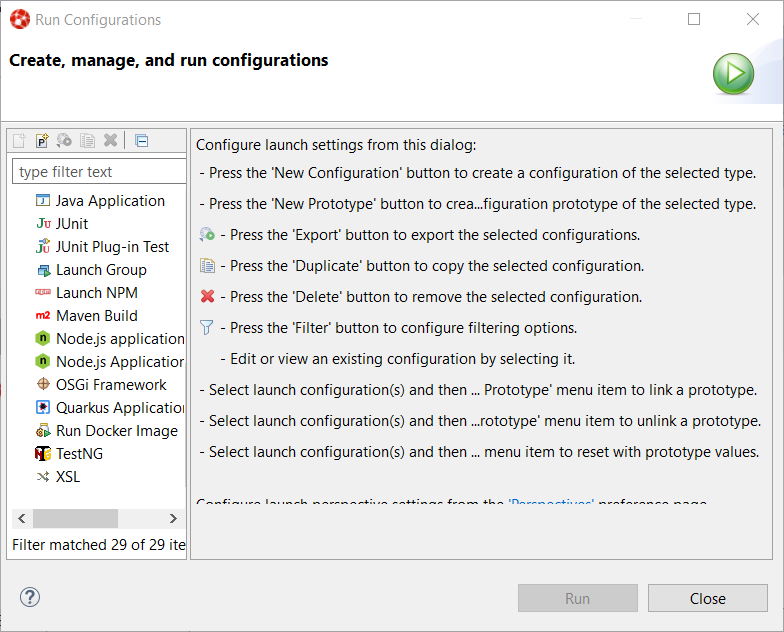
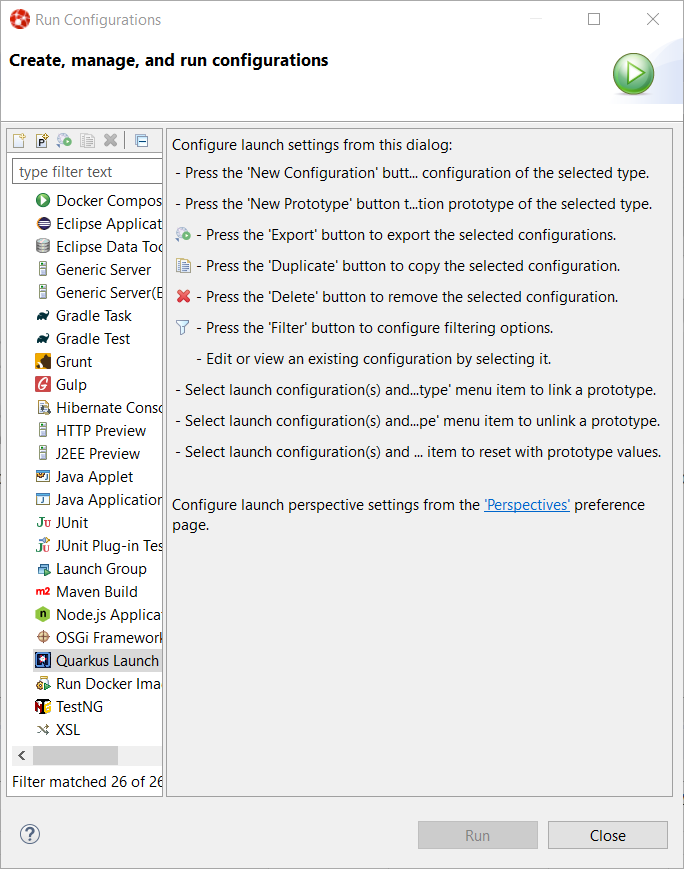
Scroll down until the Quarkus Application is visible and select it:
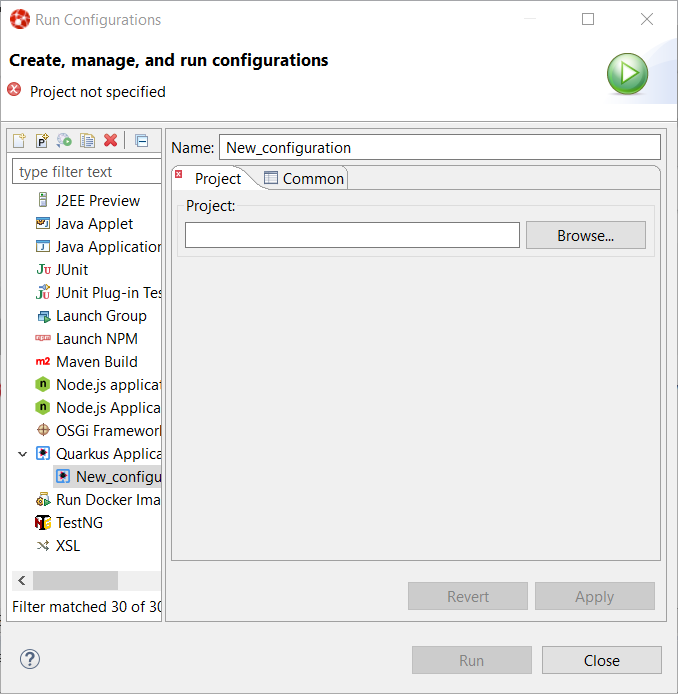
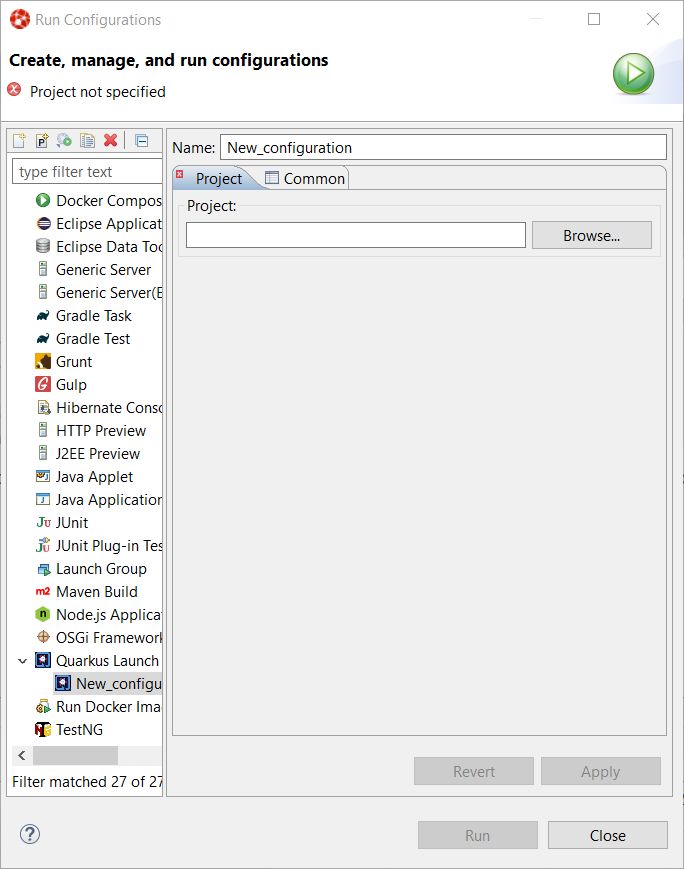
Click on the New configuration button (top left):
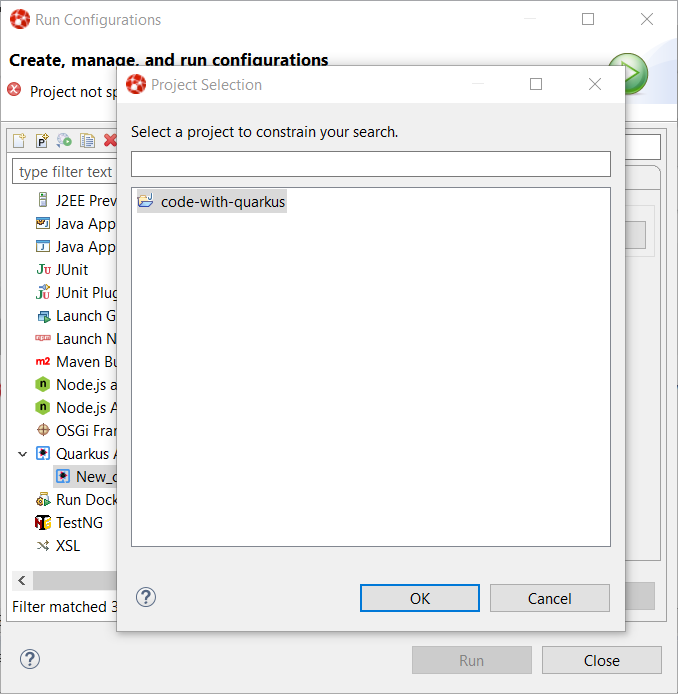
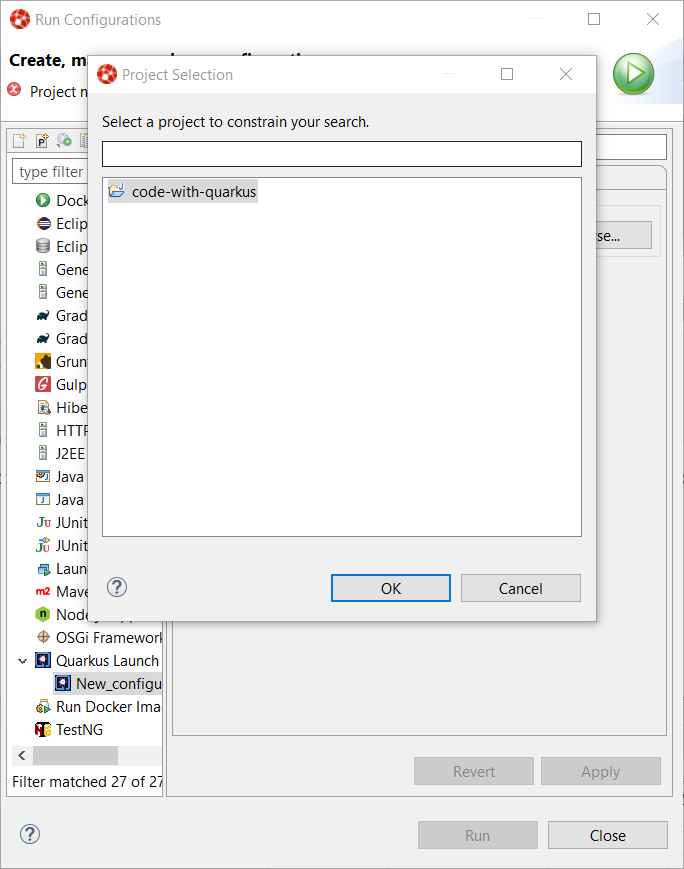
A workspace project needs to be associated with the configuration so click on the Browse button to see the project selection dialog:
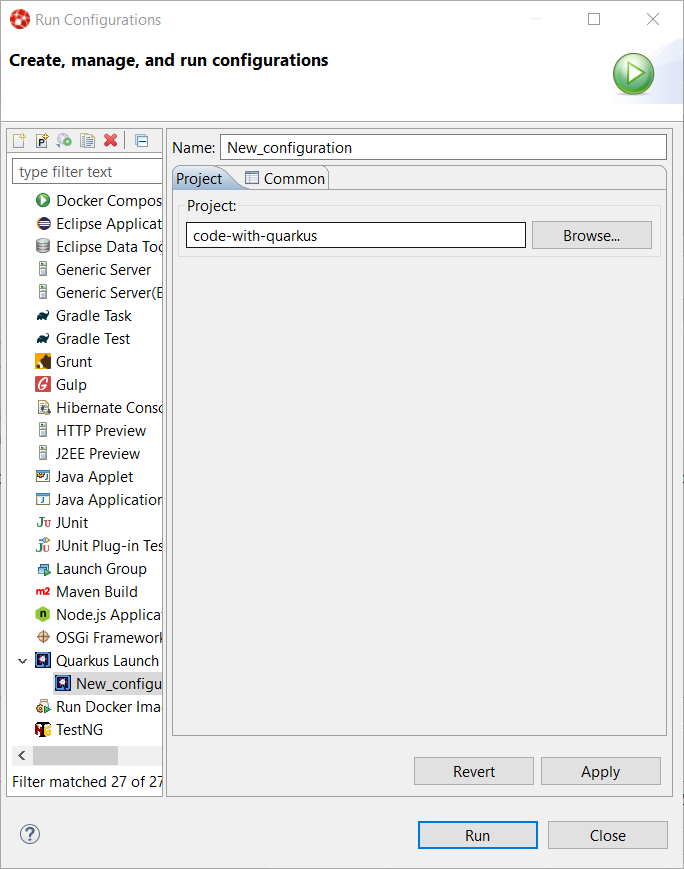
As the workspace contains a single project, it is automatically selected and we can click on the OK button:
The configuration is now ready to be used. So let’s start our Quarkus application by clicking on the Run button:
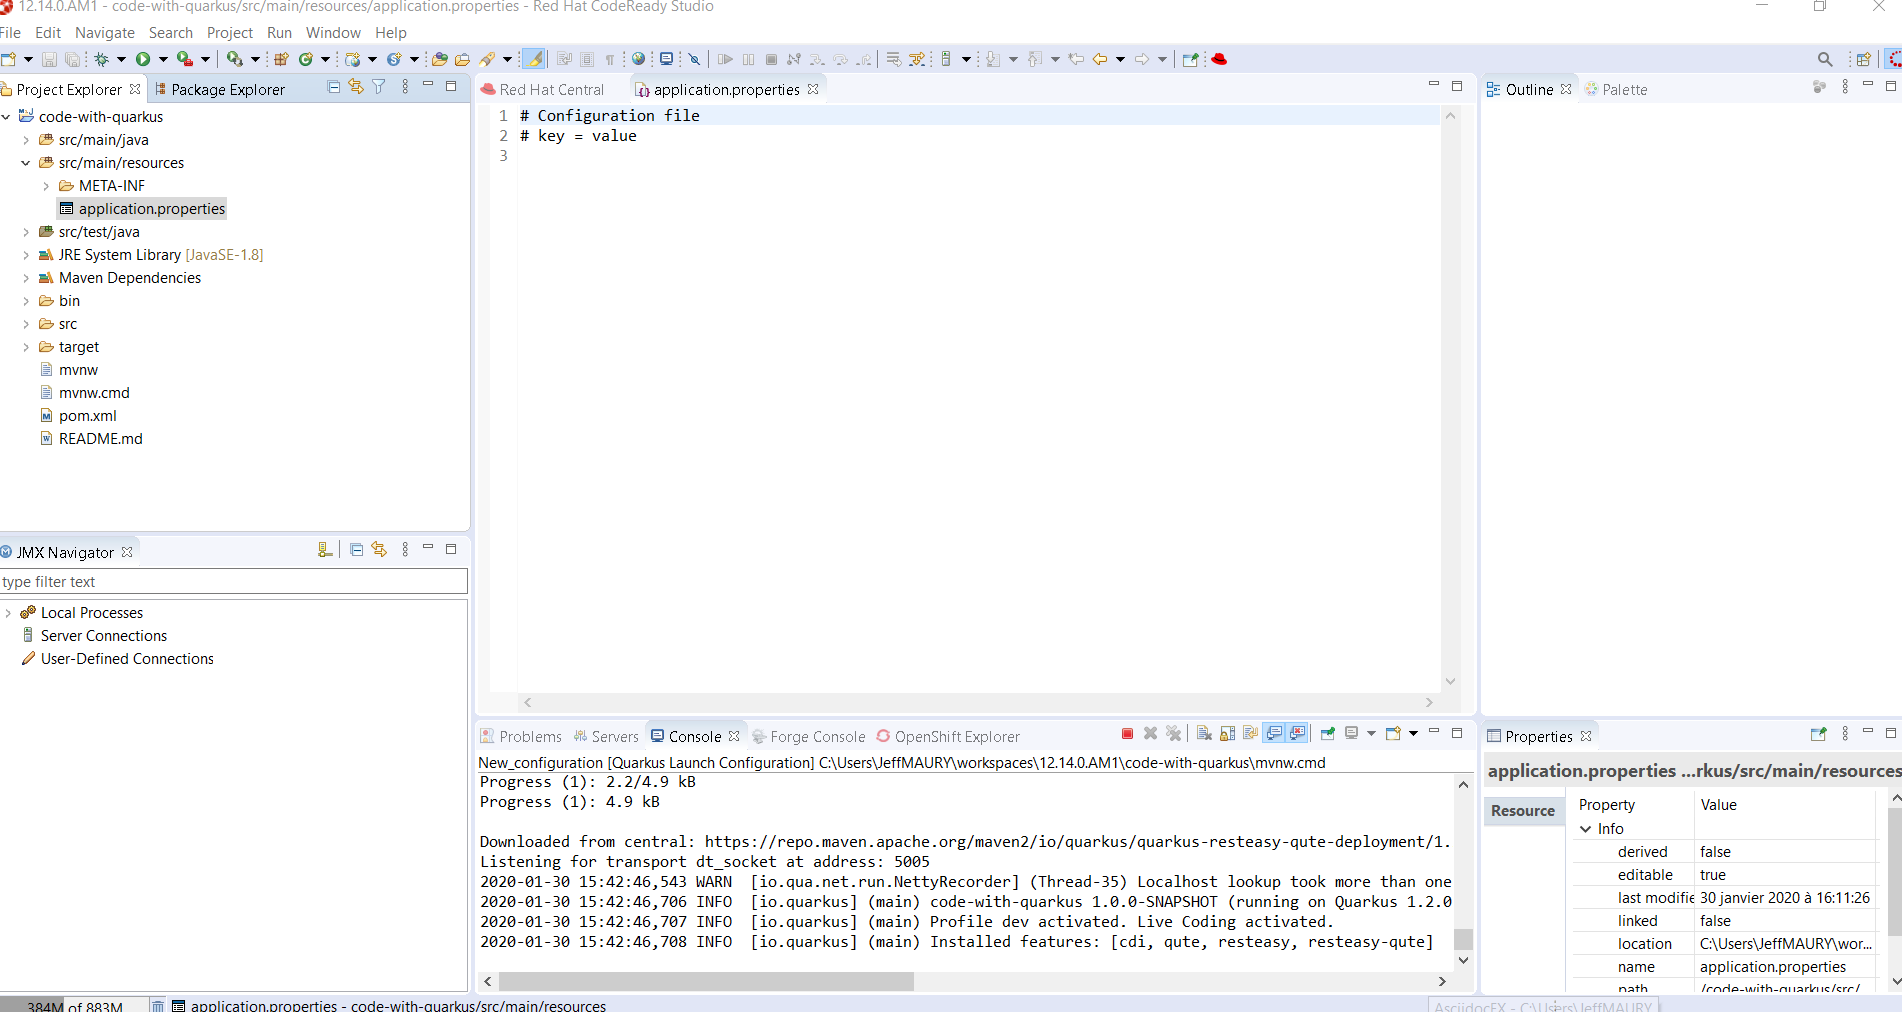
You should see a new Console being displayed.
The application is being built and after a while, it will be started:
Debugging a Quarkus application is just a simple as launching the previous configuration we’ve just created in Debug. You just need to open the Run → Debug Configurations…. menu and click on the Debug button.
It will start the Quarkus application like in the previous paragraph but also connect a remote JVM debug configuration to your running Quarkus application. So if you have set breakpoints in your application source files, the execution will automatically stops there.
Every Quarkus application is configured through a configuration called application.properties.
The content of this configuration file is dependent of the set of Quarkus extensions that your application is using. Some settings are mandatory, some others are not and the possible values are specific to the nature of the setting: boolean, integer, limited set of values (enumerations).
So, as a developer, you need to look at various guides and documentations (the core Quarkus and the extension specific ones)
So Quarkus Tools provides content assist on those specific files that:
validates the content of the application.properties files
provides you with the possible setting names and values
Let’s see it in action.
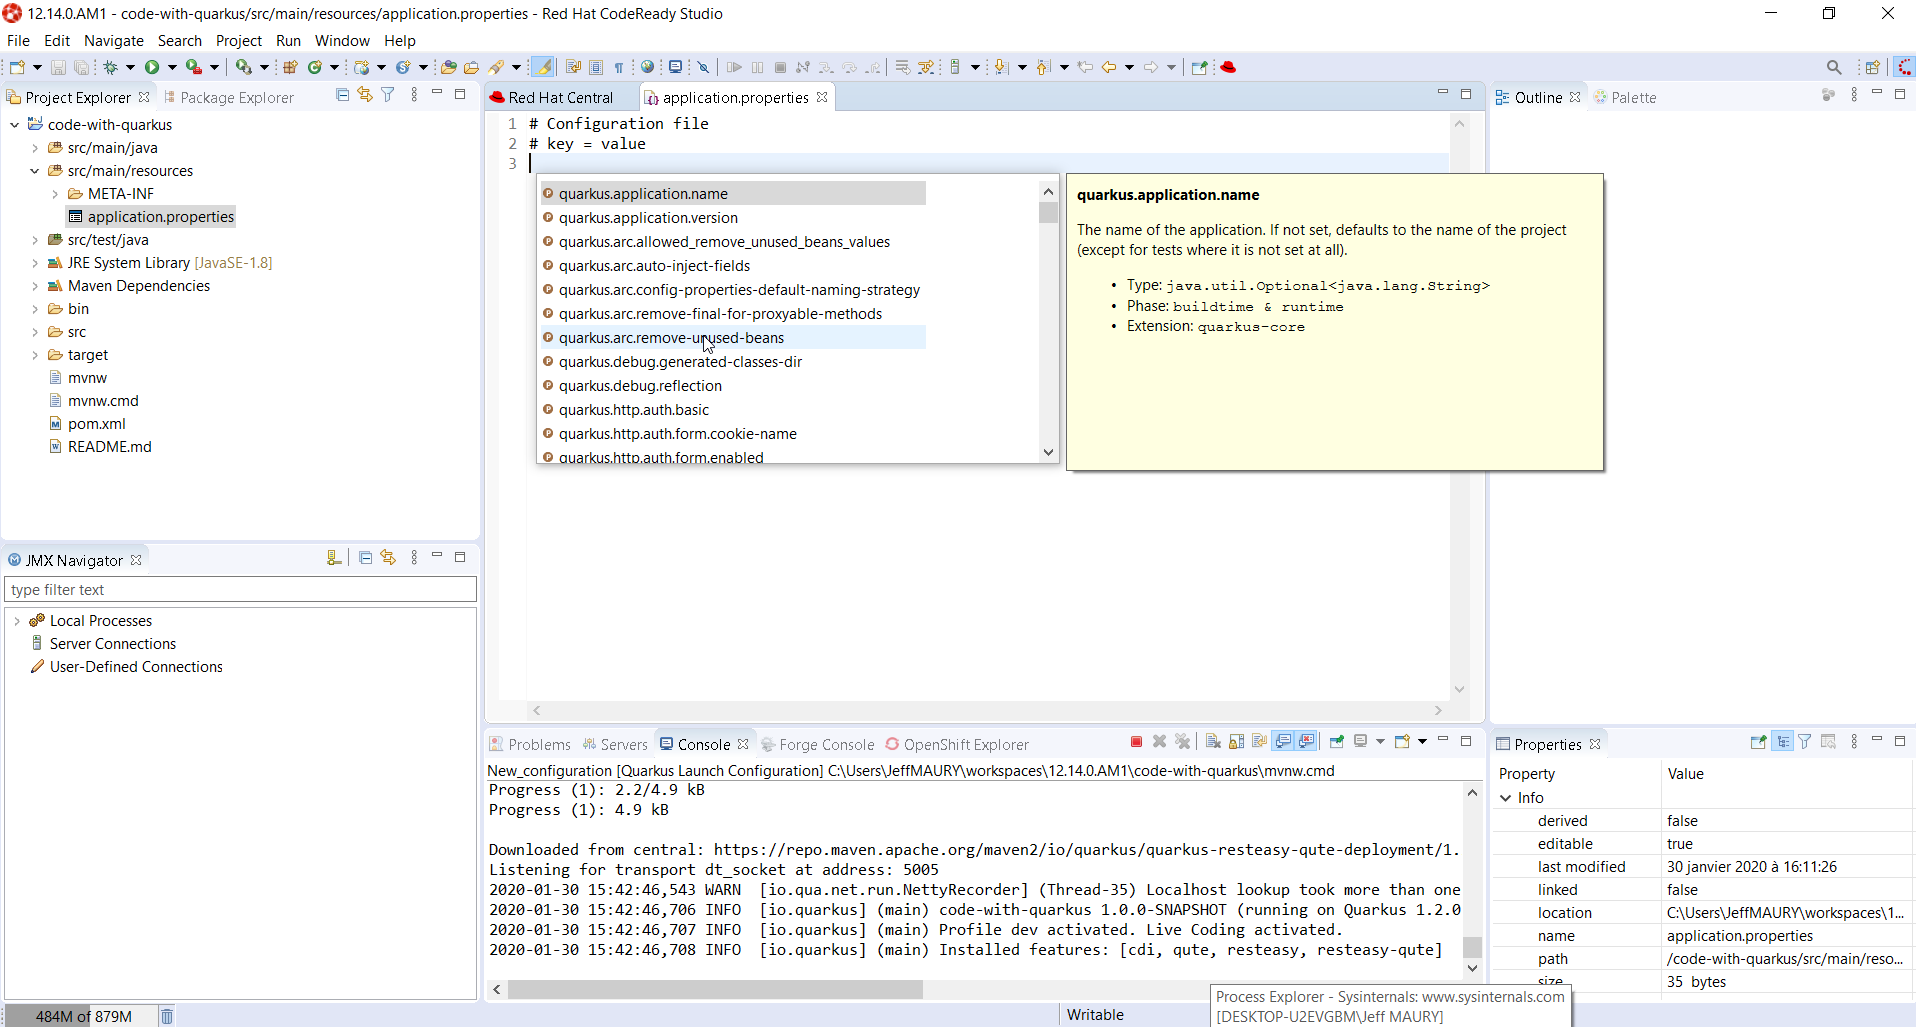
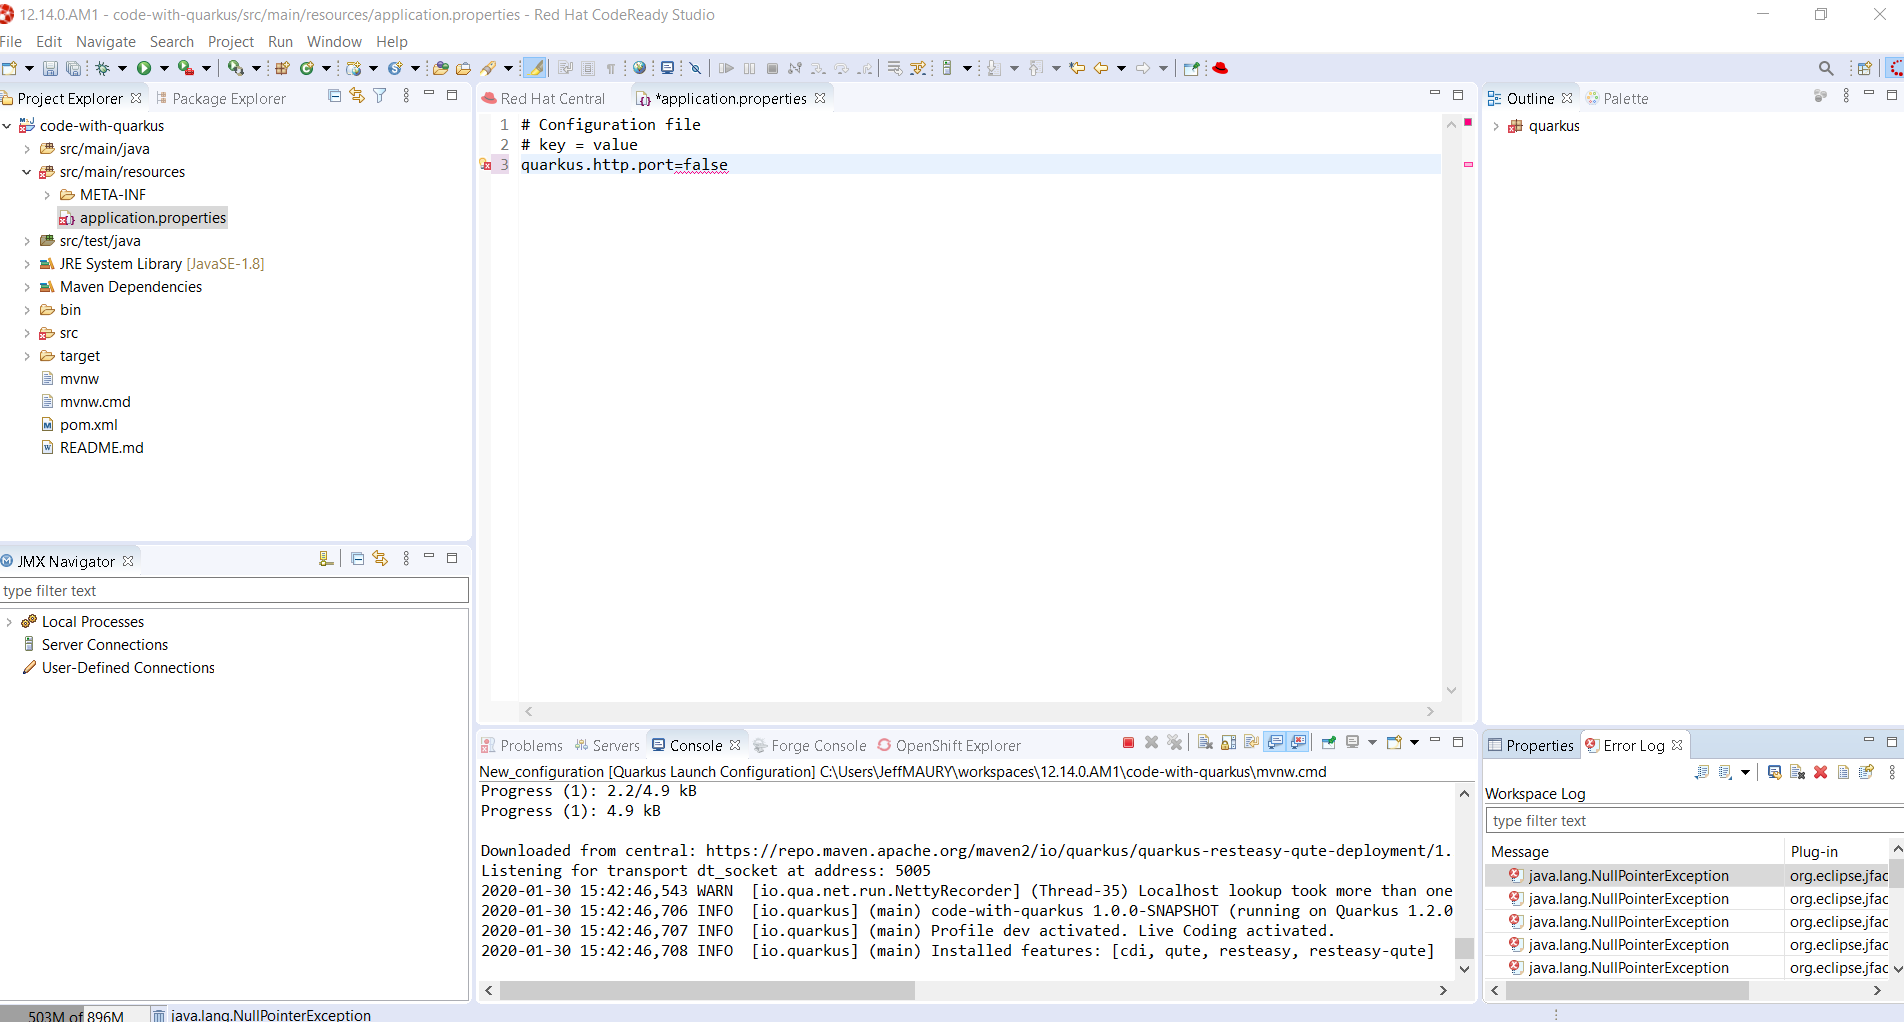
Go to src/main/resources/application.properties in the project and right click and select Open With → Generic Text Editor:
Go the third line of the file and invoke code completion (Ctrl + Space):
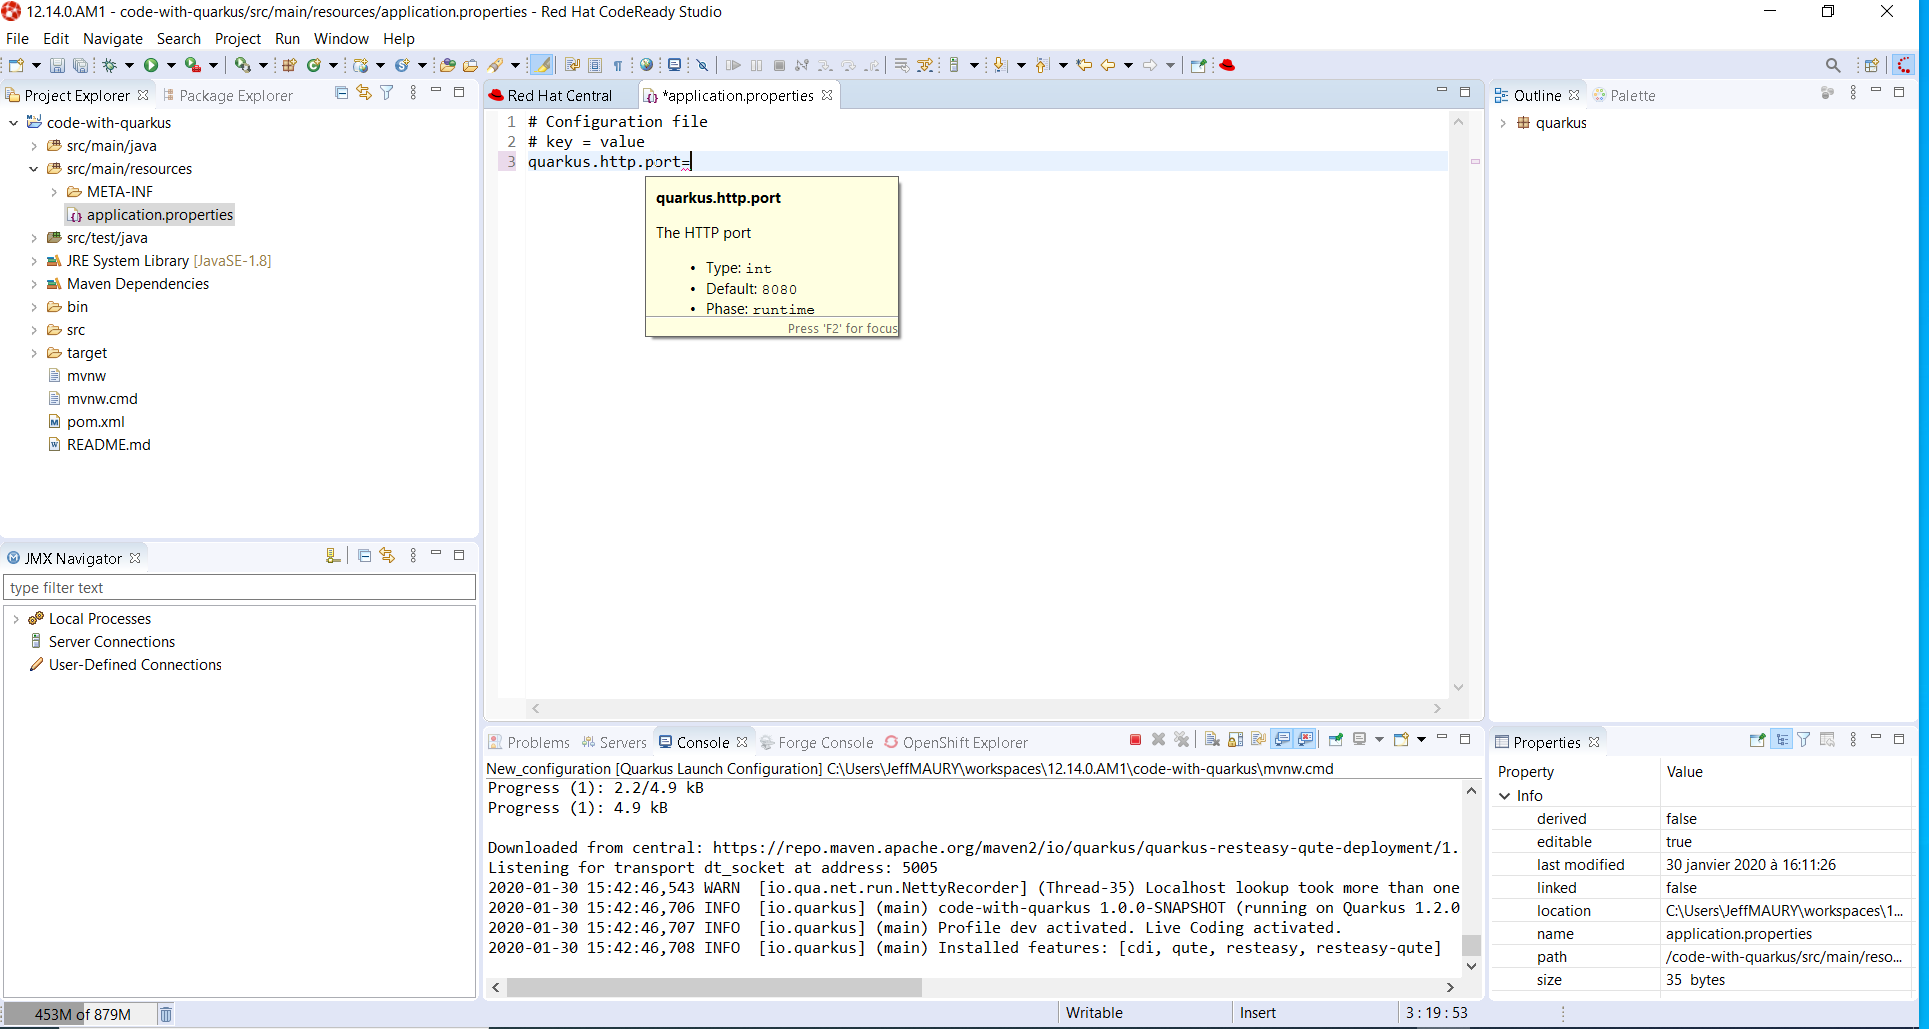
For each setting, a documentation is displayed when you mouse over the setting. Let try to add quarkus.http.port to the file and mouse over this name:
If we enter a wrong value (false instead of a numeric value), then the error will be highlighted:
This is the first set of features that will be integration into the next version of JBoss Tools. We encourage you to used it and if you are missing features and/or enhancements, don’t hesitate to report them here: JBoss Tools issue tracker
The Forge, Java Server Tools (JST) and Visual Page Editor (VPE) have been deprecated. Even though they received an update with this release, we have no plan to maintain or add new features and they may be removed in the future.
In addition, the adapters for Red Hat JBoss Enterprise Application Server 4.3 and 5.0 have also been deprecated.
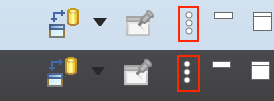
The view menu chevron icon (▽) is replaced by a modern equivalent, the vertical ellipsis ( ⠇).
Almost every view has a menu that may contain additional configuration settings like filters, layout settings, and so on. The view menu was often overlooked and we expect that this change will help users to find it.
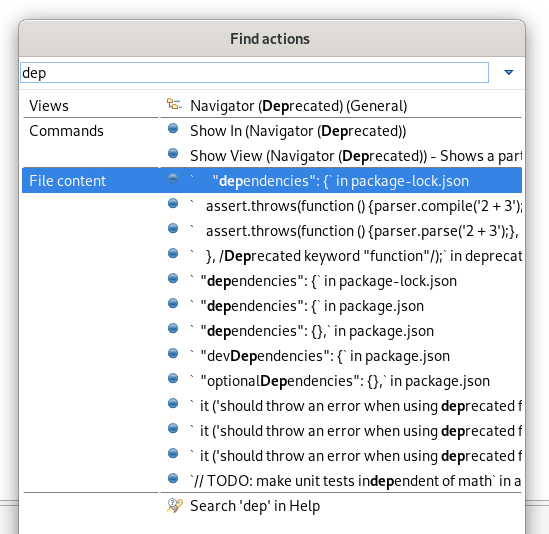
The formerly called Quick Access action has been retitled to Find Actions to better emphasize its goal.
The related UI has changed a bit to improve its usage and accessibility:
The widget item is now a regular toolbar item (button-like)
An icon is shown
Right-clicking on the tool item works and shows typical actions, including Hide
The proposals are now a regular dialog, centered on the workbench
These changes will greatly improve the experience if you’re using a screen reader as it relies on a more standardized focus state. This also leverages all the default and usual accessibility features of dialogs (moveable, resizable…).
Loading the proposals has been improved as well to avoid UI freezes when loading proposals.
Find Actions is now extended by the Quick Text Search feature to show the potential text matches in file contents also in the proposals.
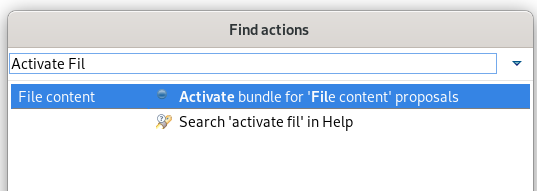
If the Quick Text Search bundle wasn’t started yet, you may miss those matches. In this case, you can use Find Actions itself to activate the Quick Text Search by finding and selecting the Activate bundle for 'File content' proposals entry.
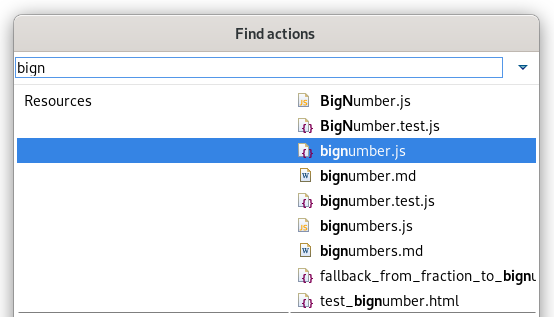
Find Actions can now list matching file names from the workspace (similar to the Open Resource dialog). Upon selection the file is opened in the editor.
In the Project Explorer, renaming (with the
shortcut or Rename context menu)
will start an inline rename for normal resources when other files aren’t affected by
the rename.F2
In cases where other files are affected by the rename, or the rename operation is customized, the rename dialog will appear as it previously did.
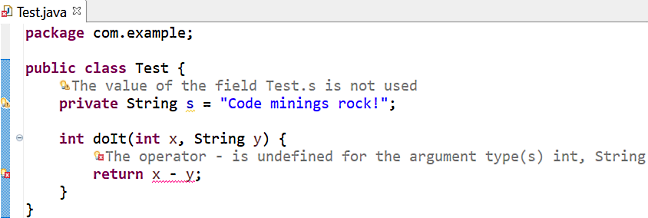
You can now see the errors, warnings, and info markers inline in most of the text editors. No more mousing around to see the actual error message!
You can see the available quick fixes by clicking on the message.
You can enable it on the General > Editors > Text Editors preference page and set Show Code Minings for Annotations to:
None (default)
Errors only
Errors and Warnings
Errors, Warnings and Info
If you use the Insert spaces for tabs option, now you can also change the backspace and delete keys behavior to remove multiple spaces at once, as if they were a tab.
The new setting is called Remove multiple spaces on backspace/delete and is found on the General > Editors > Text Editors preference page.
CSS customization of
and ExpandableComposite
was reworked to
give you more control over their styling. In dark mode, those elements now
integrate better with other Form elements.Section
Old:
New:
Java™ 13 is available and Eclipse JDT supports Java 13 for the Eclipse 4.14 release.
The release notably includes the following Java 13 features:
JEP 354: Switch Expressions (Preview).
JEP 355: Text Blocks (Preview).
Please note that these are preview language feature and hence enable preview option should be on. For an informal introduction of the support, please refer to Java 13 Examples wiki.
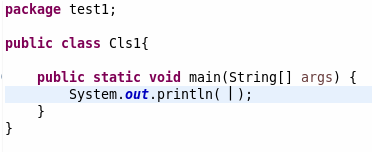
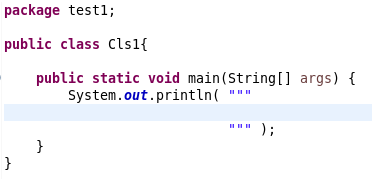
A keyboard shortcut Ctrl + Shift + ' is added in the Java Editor for text blocks, which is a preview feature added in Java 13.
Conditions under which this keyboard shortcut works are:
The Java Project should have a compliance of 13 or above and the preview features should be enabled.
The selection in the editor should not be part of a string or a comment or a text block.
Examples:
Pressing the shortcut gives:
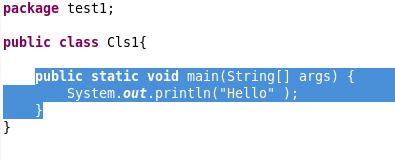
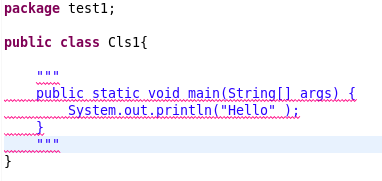
You can also encompass a selected text in text block as below:
On pressing the shortcut, you get this:
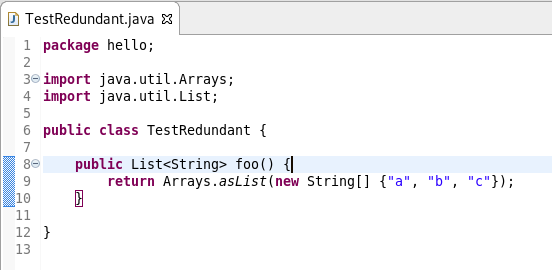
A new cleanup action Remove unnecessary array creation has been added. It will
remove explicit array creation for
parameters.varargs
For the given code:
After cleanup, you get this:
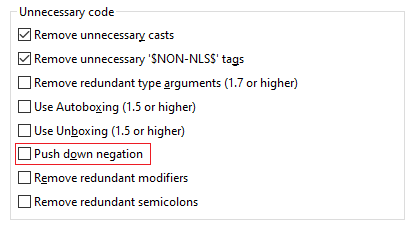
A new Java cleanup/save action Push down negation has been added. It reduces the double negation by reverting the arithmetic expressions.
For instance:
!!isValid;
becomes isValid;
!(a != b);
becomes (a == b);
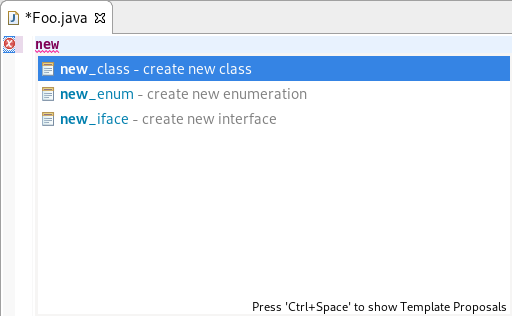
When dealing with empty Java source files, some basic templates (class, interface, enum) will now be available from the content assist popup.
Postfix completion allows certain kinds of language constructs to be applied to the previously entered text.
For example: Entering
and selecting the
var - Creates a new variable proposal, will result in "input text".var
.String name = "input text"
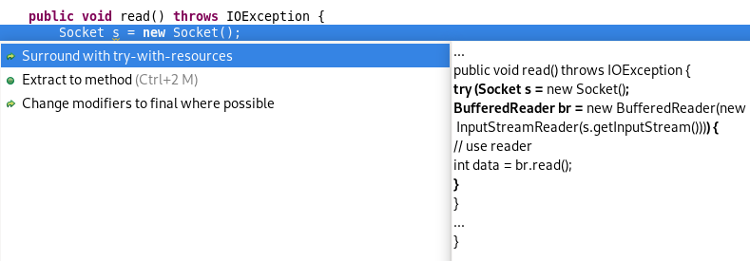
A quickfix has been added to create a
statement based on
the selected lines. Lines that are selected must start with declarations of objects
that implement try-with-resources
. These declarations are added as the resources
of the AutoCloseable
statement.try-with-resources
If there are selected statements that are not eligible resources (such as Objects
that don’t implement
), then the first such statement and all
the following selected statements will be placed in the AutoCloseable
body.try-with-resources
Method before applying try-with-resources:
Select all the lines inside the method, then use the short-cut Ctrl+1 and click on Surround with try-with-resources from the list:
This results in:
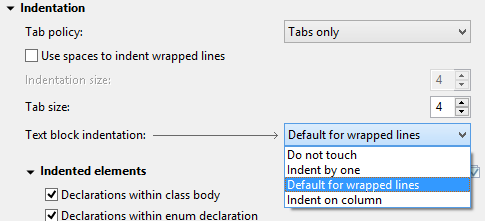
The code formatter can now handle text blocks, which is a preview feature added in Java 13. It’s controlled by the Text block indentation setting, found right in the Indentation section of the Profile Editor (Preferences > Java > Code Style > Formatter > Edit…).
By default, text block lines are indented the same way as wrapped code lines, that is with two extra tabs relative to the starting indentation (or whatever is set as Default indentation for wrapped lines in the Line Wrapping section). You can also set it to use only one tab for indentation (Indent by one), align all lines to the position of the opening quotes (Indent on column), or preserve the original formatting (Do not touch).
The code formatter can now divide Javadoc tags into groups (by type, for example
, @param
, @throws
) and separate these groups with blank
lines. This feature can be turned on in the Comments > Javadocs section by
checking the Blank lines between tags of different type box.@returns
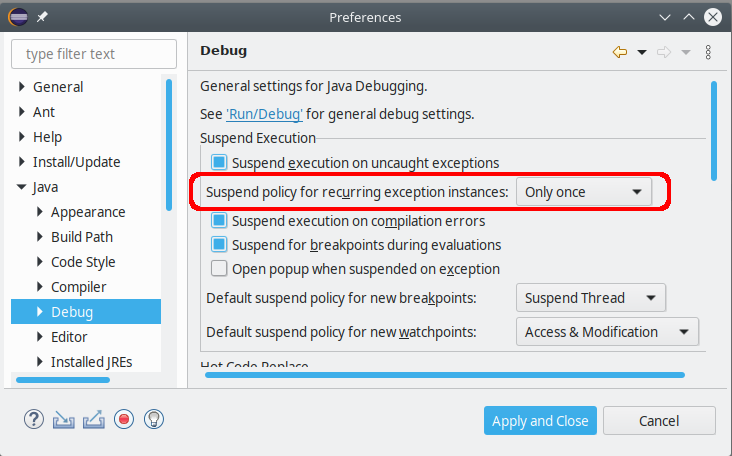
A new workspace preference has been added for exception breakpoints: Suspend policy for recurring exception instances controls whether the same exception instance may cause the debugger to suspend more than once.
This option is relevant when debugging an application that has
blocks at
several levels of the architecture. In this situation an exception breakpoint
may fire multiple times for the same actual exception instance: A try
statement inside a throw
block may re-throw the same exception. The same
holds for each catch
block or finally
block.try-with-resources
When the debugger stops due to an exception breakpoint, you may want to continue
your debug session by pressing Resume (F8), but all that catching and re-throwing
will force you to observe all locations where the same exception will surface again
and again. Suspending at all
blocks on the call stack may also spoil your
context of open Java editors, by opening more editors of classes that are likely
irrelevant for the debugging task at hand.try
The JDT Debugger will now detect this situation, and the first time it notices the same exception instance recurring at the surface, a new question dialog is shown:
If you select Skip in this dialog, the current exception instance will be dismissed for good. Still, new instances of the same exception type will cause suspending when they are thrown.
If you check Remember my decision your choice will be stored in the mentioned workspace preference to be effective for all exception breakpoints.
Even after choosing Skip — resp. Only once in the preferences — you can have the old behavior simply by pressing Step Return (F7) instead of Resume.
The existing
,
org.eclipse.jdt.ui.javaCompletionProposalComputer
and
org.eclipse.jdt.ui.javadocCompletionProposalComputer
extension points now allow
a new attribute requiresUIThread that allows a developer to declare whether running
in the UI thread is required or not.org.eclipse.jdt.ui.javaCompletionProposalSorters
This information will be used by the Content Assist operation to allow some optimizations and prevent UI freezes by reducing the amount of work happening in the UI thread.
To preserve backward compatibility, the default value for this attribute (if unset)
is
, meaning the extension is expected to run in the UI thread.true
You can find more noteworthy updates in on this page.
Happy to announce 4.14.0.AM1 (Developer Milestone 1) build for Eclipse 2019-12.
Downloads available at JBoss Tools 4.14.0 AM1.
Full info is at this page. Some highlights are below.
A new component has been added to JBoss Tools. Quarkus Tools. It aims at providing tools for Quarkus applications developers. The initial set of features is:
Wizard for creating Quarkus projects based on code.quarkus.io
Code completion and syntax validation on application.properties
Launching your Quarkus application in Run/Debug mode
A new wizard has been added to create a new Quarkus application project in your workspace. In order to launch it, first enter Ctrl+N to get the list of available wizards
In the filter text box, enter the
characters to filter the list of wizards:qu
Select the Quarkus Project wizard and click the Next button:
The Project type combo allows you to choose between Maven or Gradle tool used to manage your project. We’ll go with Maven for this tutorial.
Enter a project name (we will use code-with-quarkus) and click the Next button:
This dialog allows you to choose various parameters for you project, like the project coordinates (group id, artifact id and version) along with the base REST endpoint information. We’ll use the default so click on the Next button:
This dialog allows to select which Quarkus extensions you want to add to your project. The extensions are grouped by categories, so first select a specific category in the left table. We will choose the Web one:
You should have noticed that the middle table has been updated. In order to add an extension, double click on the extension in the middle table. We will add RESTEasy JAX-RS and RESTEasy Qute (a templating engine):
You should have noticed that the extensions that you double clicked on are now being added to the right table. If you want to remove an extension from the list of selected ones, double click again either in the center table or in the right table.
We are now all set so click on the Finish button to launch the project creation. The project creation job is then launched, dependencies are being retrieved and after a while, the new project will appear in the Project Explorer window:
We have successfully created our first Quarkus project. Let’s see now how we can launch this application and debug it.
Running a Quarkus application can be done from the workbench Run configurations. Select the Run → Run Configurations… menu to display the dialog allowing to create a Run configuration.
Scrool down until the Quarkus Launch Configuration is visible and select it:
Click on the New configuration button (top left):
A workspace project needs to be associated with the configuration so click on the Browse button to see the project selection dialog:
As the workspace contains a single project, it is automatically selected and we can click on the OK button:
The configuration is not ready to be used. So let’s start our Quarkus application by clicking on the Run button:
You should see a new Console being displayed.
The application is being built and after a while, it will be started:
Debugging a Quarkus application is just a simple as launching the previous configuration we’ve just created in Debug. You just need to open the Run → Debug Configurations…. menu and click on the Debug button.
It will start the Quarkus application like in the previous paragraph but also connect a remote JVM debug configuration to your running Quarkus application. So if you have set breakpoints in your application source files, the execution will automatically stops there.
Every Quarkus application is configured through a configuration called application.properties.
The content of this configuration file is dependent of the set of Quarkus extensions that your application is using. Some settings are mandatory, some others are not and the possible values are specific to the nature of the setting: boolean, integer, limited set of values (enumerations).
So, as a developer, you need to look at various guides and documentations (the core Quarkus and the extension specific ones)
So Quarkus Tools provides content assist on those specific files that:
validates the content of the application.properties files
provides you with the possible setting names and values
Let’s see it in action.
Go to src/main/resources/application.properties in the project and right click and select Open With → Generic Text Editor:
Go the third line of the file and invoke code completion (Ctrl + Space):
For each setting, a documentation is displayed when you mouse over the setting. Let try to add quarkus.http.port to the file and mouse over this name:
If we enter a wrong value (false instead of a numeric value), then the error will be highlighted:
This is the first set of features that will be integration into the next version of JBoss Tools. We encourage you to used it and if you are missing features and/or enhancements, don’t hesitate to report them here: JBoss Tools issue tracker
Enjoy!
Jeff Maury
JBoss Tools 4.13.0 and Red Hat CodeReady Studio 12.13 for Eclipse 2019-09 are here waiting for you. Check it out!
Red Hat CodeReady Studio comes with everything pre-bundled in its installer. Simply download it from our Red Hat CodeReady product page and run it like this:
java -jar codereadystudio-<installername>.jar
JBoss Tools or Bring-Your-Own-Eclipse (BYOE) CodeReady Studio require a bit more:
This release requires at least Eclipse 4.13 (2019-09) but we recommend using the latest Eclipse 4.13 2019-09 JEE Bundle since then you get most of the dependencies preinstalled.
Once you have installed Eclipse, you can either find us on the Eclipse Marketplace under "JBoss Tools" or "Red Hat CodeReady Studio".
For JBoss Tools, you can also use our update site directly.
http://download.jboss.org/jbosstools/photon/stable/updates/
Our main focus for this release was improvements for container based development and bug fixing. Eclipse 2019-09 itself has a lot of new cool stuff but let me highlight just a few updates in both Eclipse 2019-09 and JBoss Tools plugins that I think are worth mentioning.
With the new OpenShift Container Platform (OCP) 4.2 now available (see this article), even if this is a major shift compared to OCP 3, JBoss Tools is compatible with this major release in a transparent way. Just define your connection to your OCP 4.2 based cluster as you did before for an OCP 3 cluster, and use the tooling !
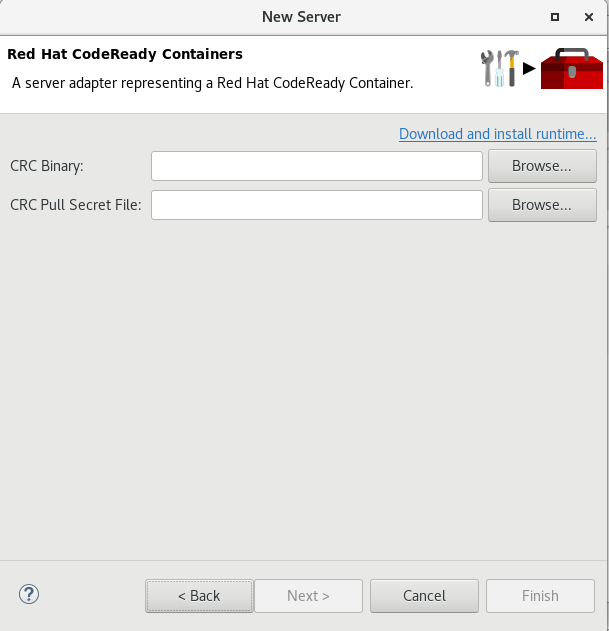
A new server adapter has been added to support the next generation of CodeReady Containers 1.0.
While the server adapter itself has limited functionality, it is able to start and stop the CodeReady Containers virtual machine via its crc binary.
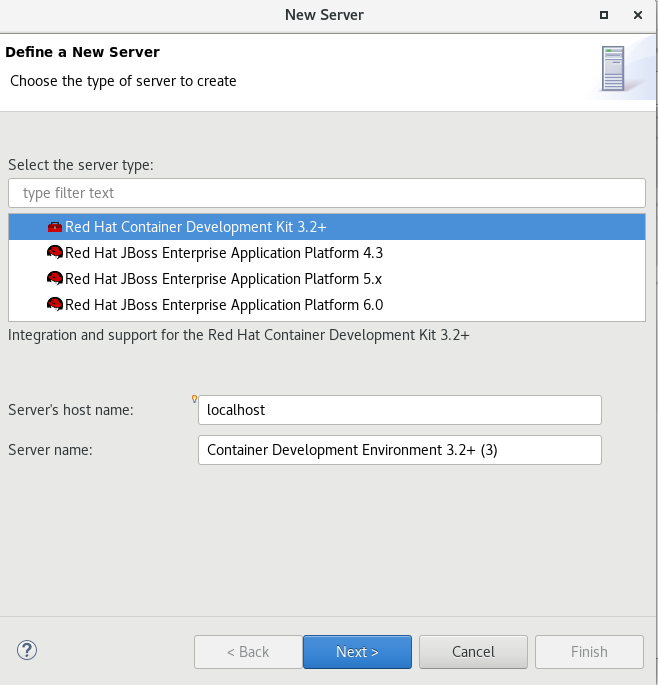
Simply hit Ctrl+3 (Cmd+3 on OSX) and type new server
, that will bring up a command to setup a new server.
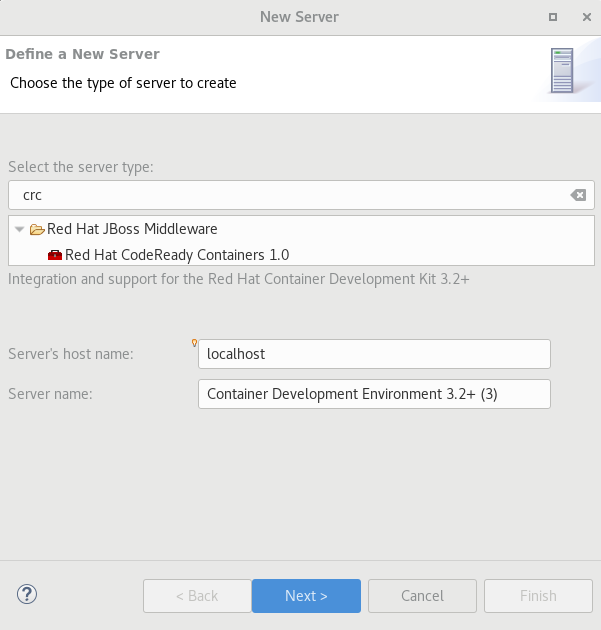
Enter crc
in the filter textbox.
You should see the Red Hat CodeReady Containers 1.0 server adapter.
Select Red Hat CodeReady Containers 1.0 and click the Next button.
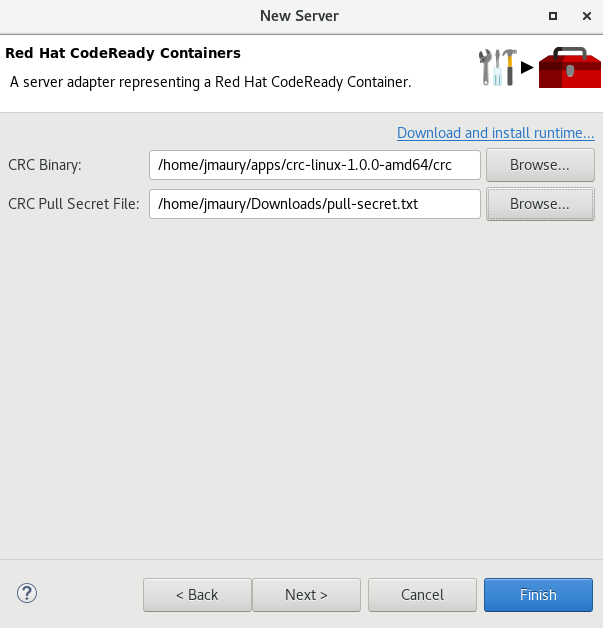
All you have to do is set the location of the CodeReady Containers crc binary file, the pull secret file location (the pull secret file can be downloaded from https://cloud.redhat.com/openshift/install/crc/installer-provisioned).
Once you’re finished, a new CodeReady Containers server adapter will then be created and visible in the Servers view.
Once the server is started, a new OpenShift connection should appear in the OpenShift Explorer View, allowing the user to quickly create a new Openshift application and begin developing their AwesomeApp in a highly-replicatable environment.
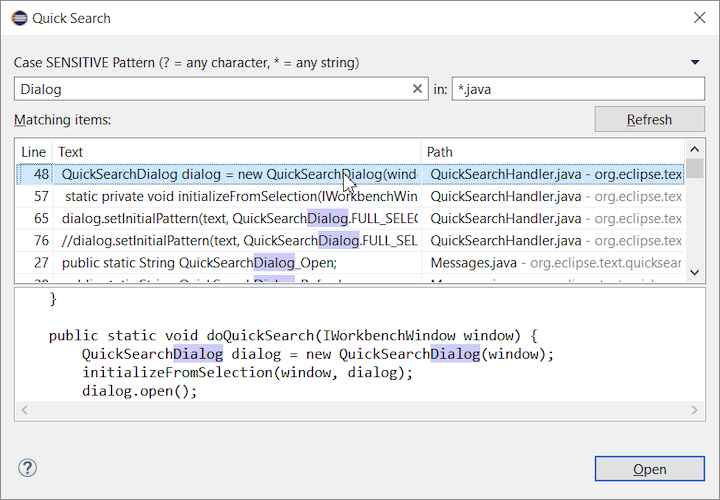
The new Quick Search dialog provides a convenient, simple and fast way to run a textual search across your workspace and jump to matches in your code. The dialog provides a quick overview showing matching lines of text at a glance. It updates as quickly as you can type and allows for quick navigation using only the keyboard. A typical workflow starts by pressing the keyboard shortcut Ctrl+Alt+Shift+L (or Cmd+Alt+Shift+L on Mac). Typing a few letters updates the search result as you type. Use Up-Down arrow keys to select a match, then hit Enter to open it in an editor.
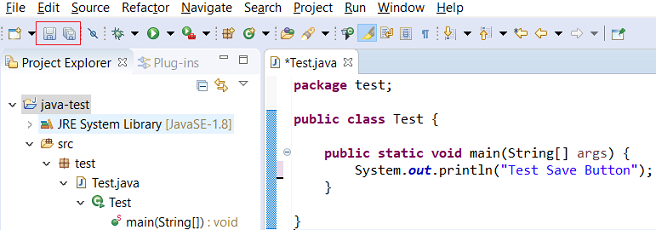
You can now save the active editor even when the Project Explorer has focus. In cases where an extension contributes Saveables to the Project Explorer, the extension is honored and the save action on the Project Explorer will save the provided saveable item instead of the active editor.
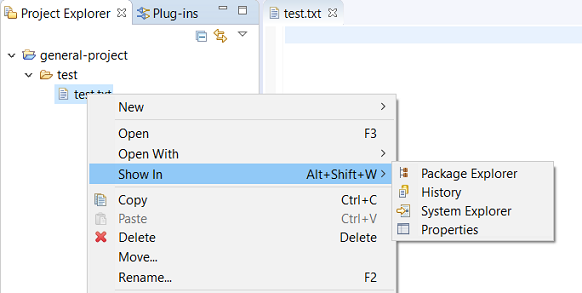
The Show In context menu is now available for an element inside a resource project on the Project Explorer.
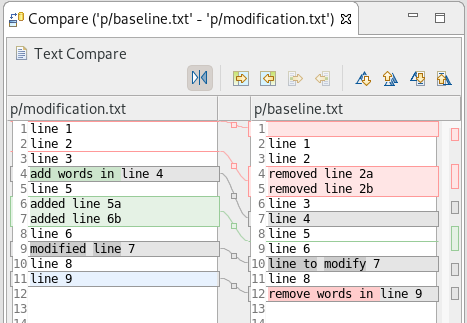
In simple cases such as a 2-way comparison or a 3-way comparison with no merges and conflicts, the Compare Viewer now shows different colors, depending on whether text has been added, removed or modified. The default colors are green, red and black respectively.
The colors can be customized through usual theme customization approaches, including using related entries in the Colors and Fonts preference page.
The status line for Text Editors now shows the cursor position, and when the editor has something selected, shows the number of characters in the selection as well. This also works in the block selection mode.
These two new additions to the status line can be disabled via the General > Editors > Text Editors preference page.
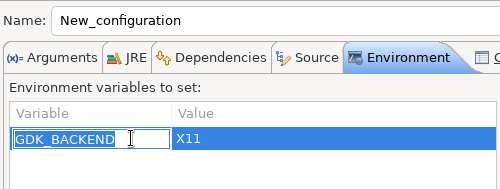
In the Environment Tab of the Launch Configuration dialog, you can now double-click on an environment variable name or value and start editing it directly from the table.
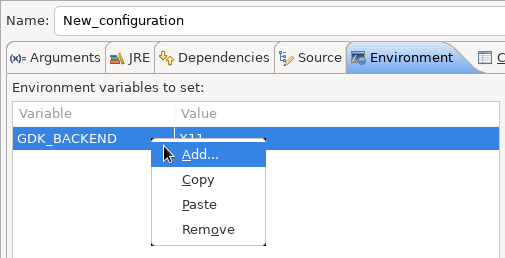
Right-clicking on the environment variable table now opens a context menu, allowing for quick addition, removal, copying, and pasting of environment variables.
The preference to close editors automatically is now enabled by default. It will be triggered when you have opened 99 files. If you continue to open editors, old editors will be closed to protect you from performance problems. You can modify this setting in the Preferences dialog via the General > Editors > Close editors automatically preference.
You can now see all the colors currently being used in Text Editors from the Appearance color options table, located in the Preferences > General > Editors > Text Editor page.
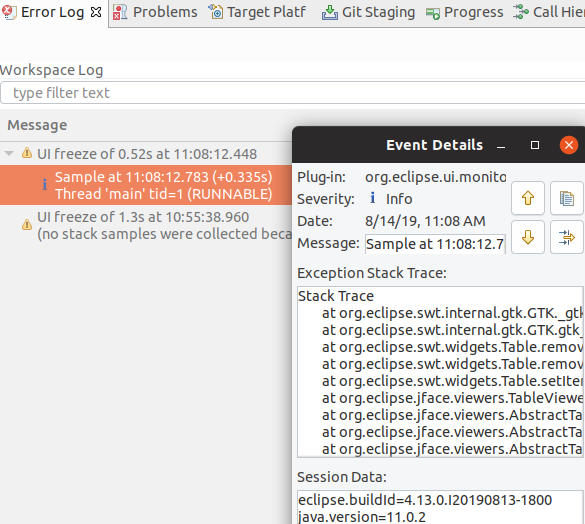
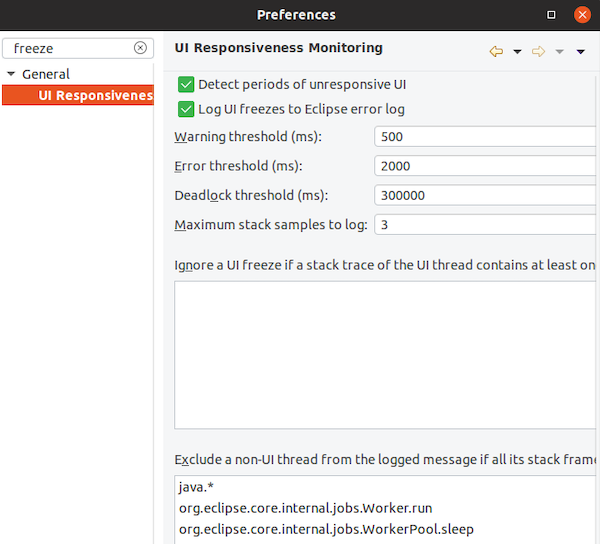
The Eclipse SDK has been configured to show stack traces for UI freezes in the Error Log view by default for new workspaces. You can use this information to identify and report slow parts of the Eclipse IDE.
You can disable the monitoring or tweak its settings via the options in the General > UI Responsiveness Monitoring preference page as shown below.
On Linux and Mac, Eclipse can now start automatically in dark theme when the OS theme is dark. This works by default, that is on a new workspace or when the user has not explicitly set or changed the theme in Eclipse.
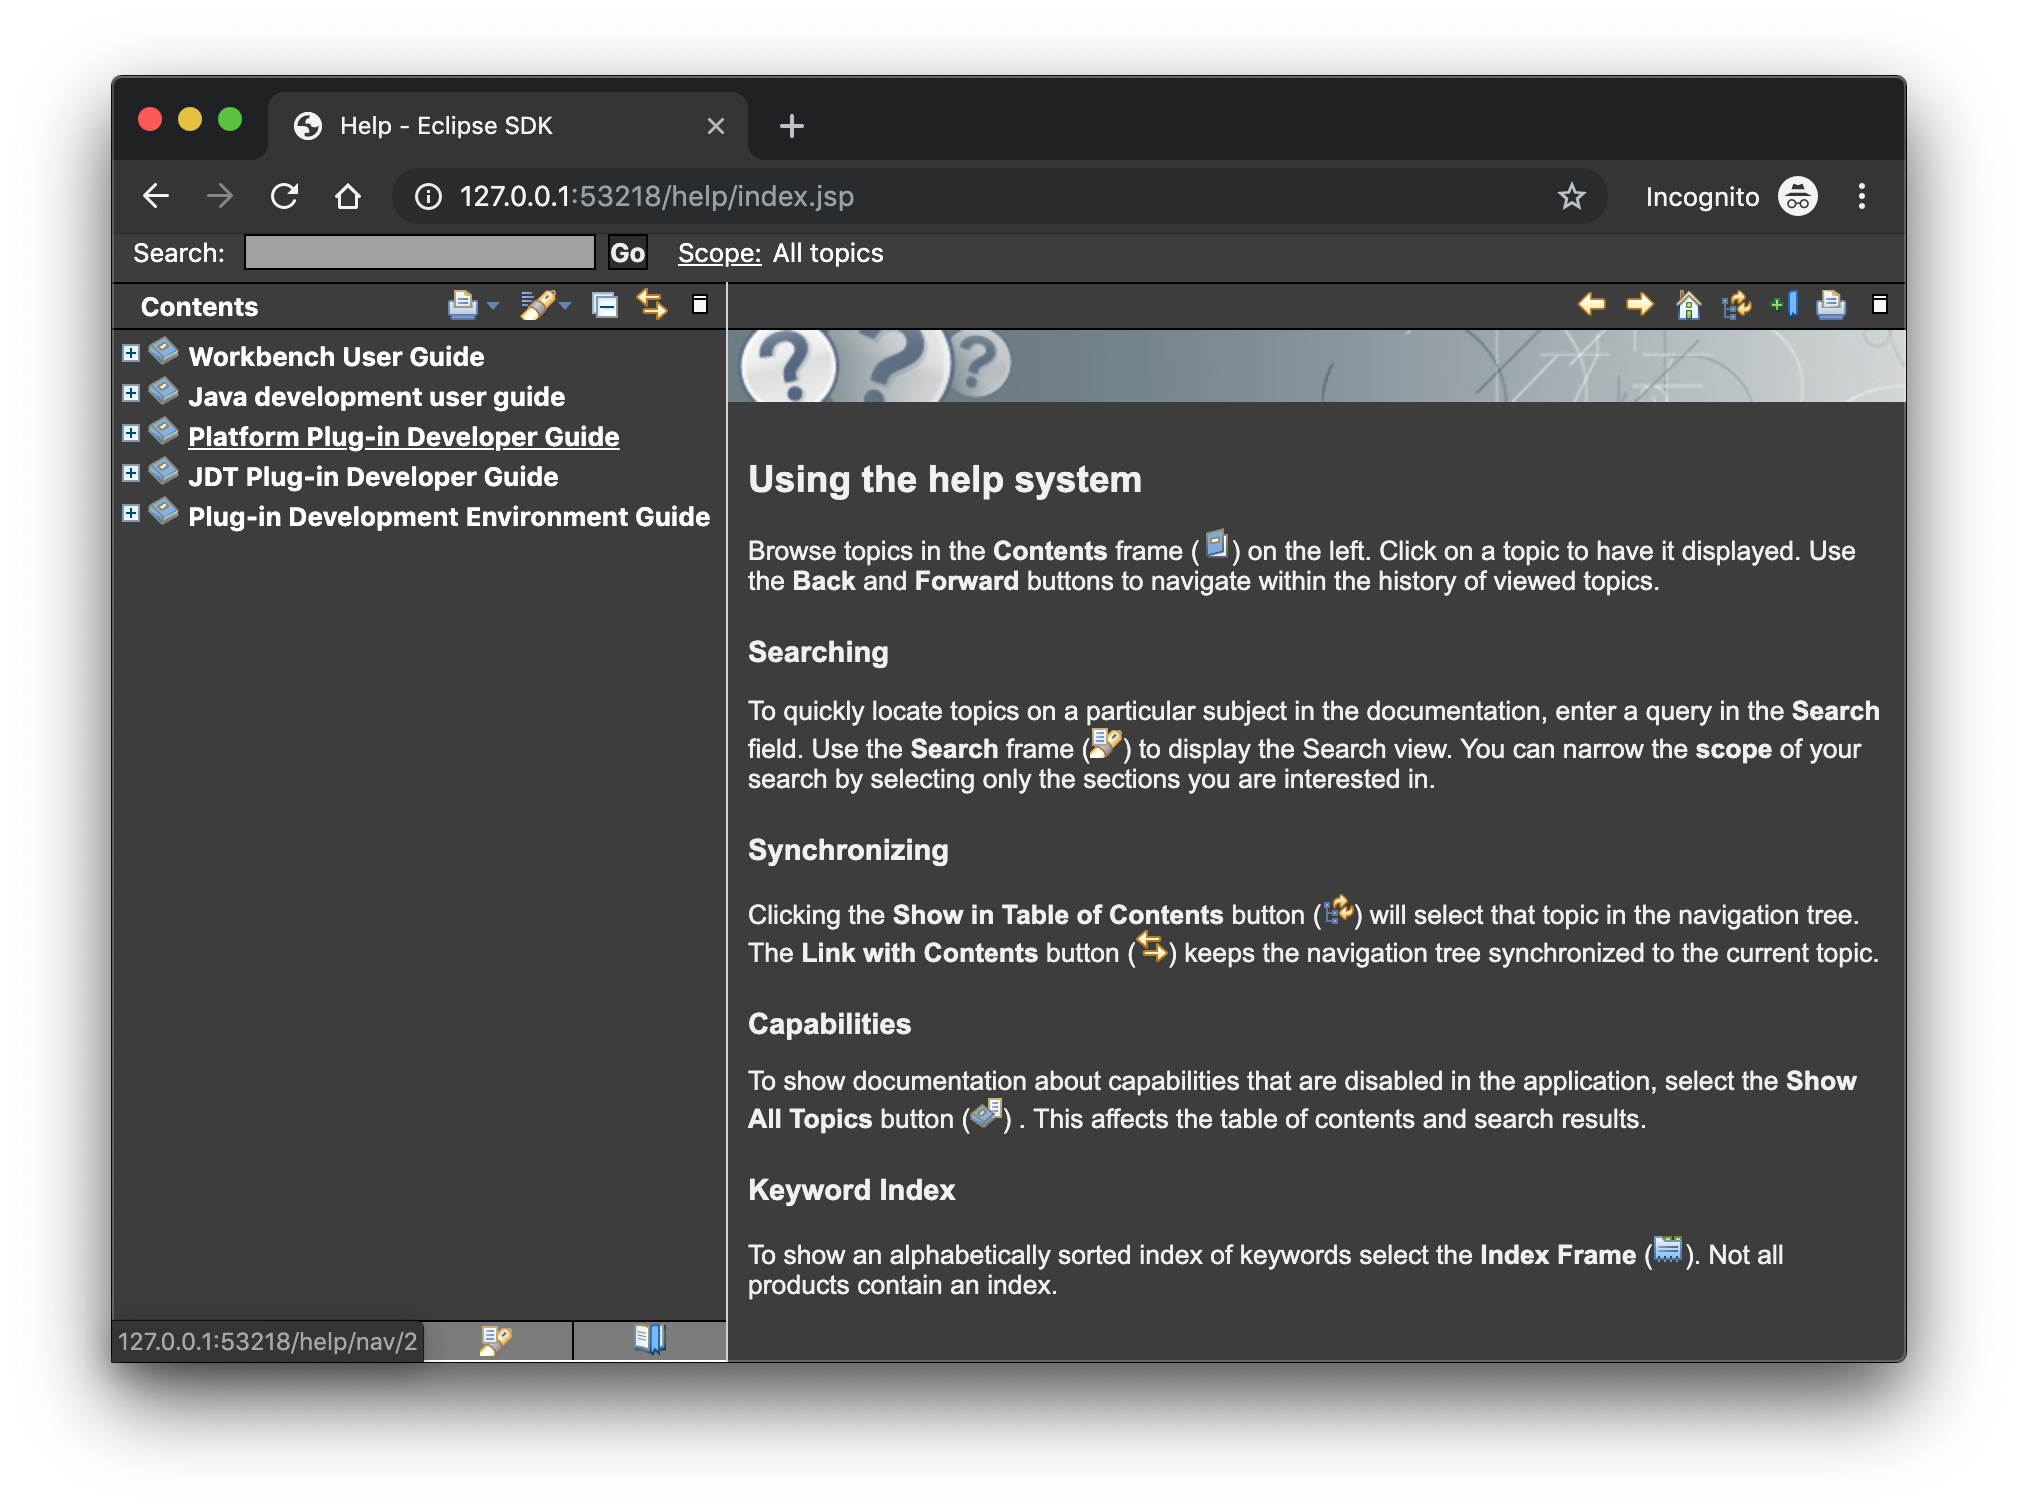
More and more operating systems provide a system wide dark theme. Eclipse now respects this system wide theme setting when the Eclipse help content is displayed in an external browser. A prerequisite for this is a browser that supports the prefers-color-scheme CSS media query.
As of writing this the following browser versions support it:
Firefox version 67
Chrome version 76
Safari version 12.1
The Help System as well as the help content of the Eclipse Platform, the Java Development Tooling and the Plug-in Development Environment now use high resolution icons. They are now crisp on high resolution displays and also looks much better in the dark theme.
Interactive performance has been further improved in this release and several UI freezes have been fixed.
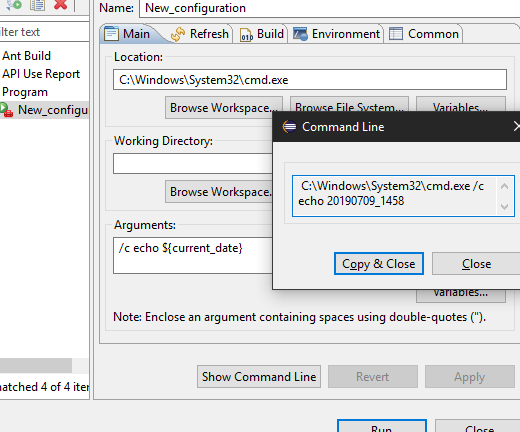
For presentations, screen casts and learning purposes, it is very helpful to show the corresponding key binding when a command is invoked. When the command is invoked (via a key binding or menu interaction) the key binding, the command’s name and description are shown on the screen.
You can activate this in the Preferences dialog via the Show key binding when command is invoked check box on the General > Keys preference page. To toggle this setting quickly the command 'Toggle Whether to Show Key Binding' can be used (e.g. via the quick access).
Java 13 is out and Eclipse JDT supports Java 13 for 4.13 via Marketplace.
The release notably includes the following Java 13 features:
JEP 354: Switch Expressions (Preview).
JEP 355: Text Blocks (Preview).
Please note that these are preview language feature and hence enable preview option should be on. For an informal introduction of the support, please refer to Java 13 Examples wiki.
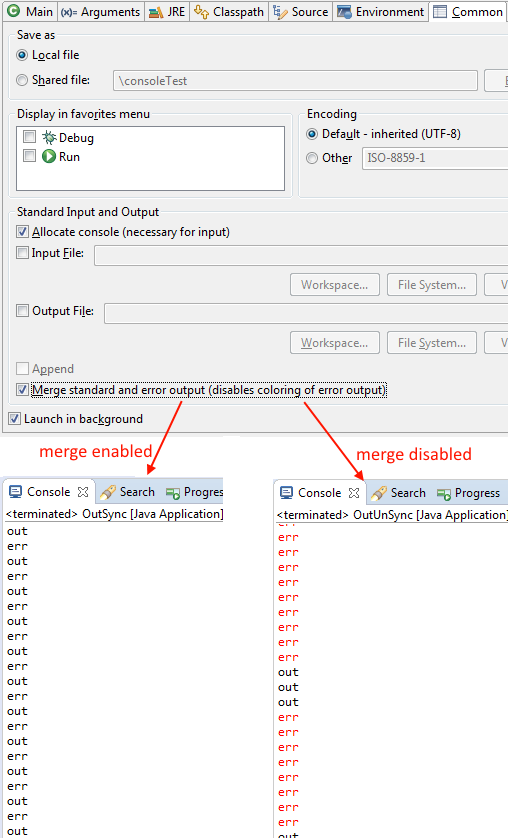
The Eclipse Console view currently can not ensure that mixed standard and error output is shown in the same order as it is produced by the running process. For Java applications the launch configuration Common Tab now provides an option to merge standard and error output. This ensures that standard and error output is shown in the same order it was produced but at the same time disables the individual coloring of error output.
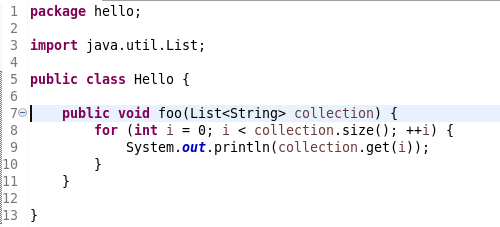
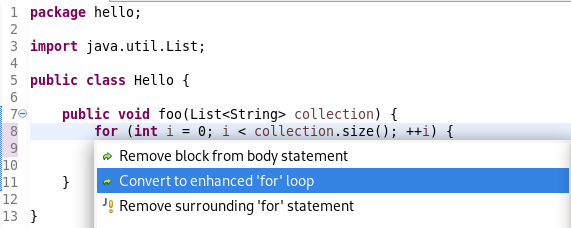
The Java quickfix/cleanup Convert to enhanced 'for' loop is now offered on
loops that are iterating
through Collections. The loop must reference the for
method as part of the condition and if accessing
elements in the body, must use the size
method. All other Collection methods other than get
invalidate the quickfix being offered.isEmpty
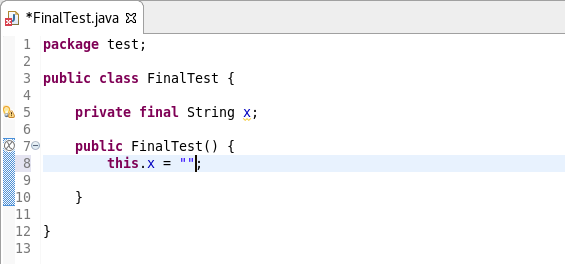
A Java quickfix is now offered to initialize an uninitialized
field in the class constructor.
The fix will initialize a final
to the empty string, a numeric base type to 0, and for class fields it initializes them using their default constructor if available or String
if no default constructor exists.null
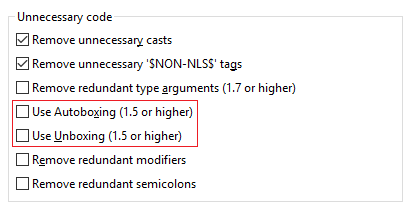
Use Autoboxing and Unboxing when possible. These features are enabled only for Java 5 and higher.
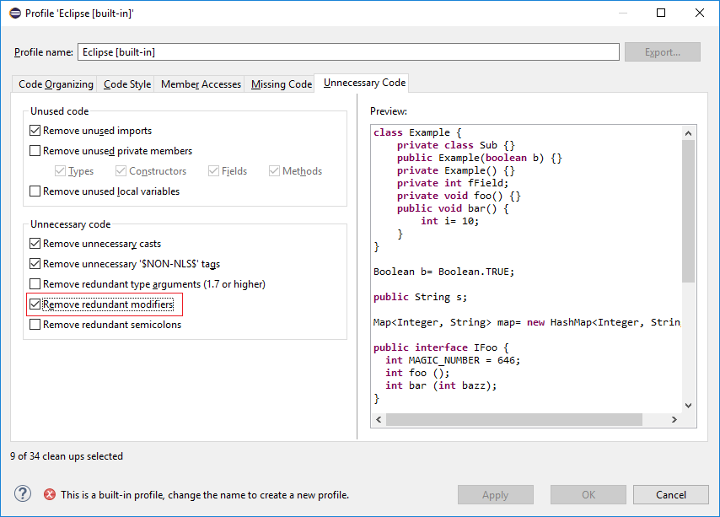
Remove redundant modifier now also removes useless
modifier on the interfaces.abstract
For the given code:
You get this:
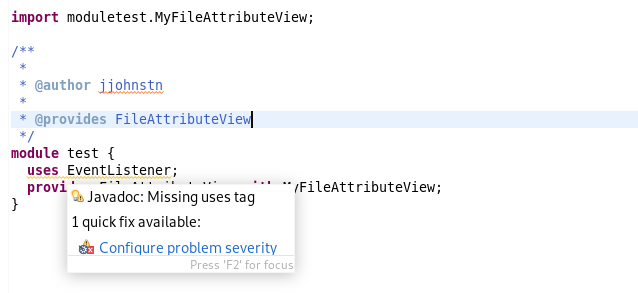
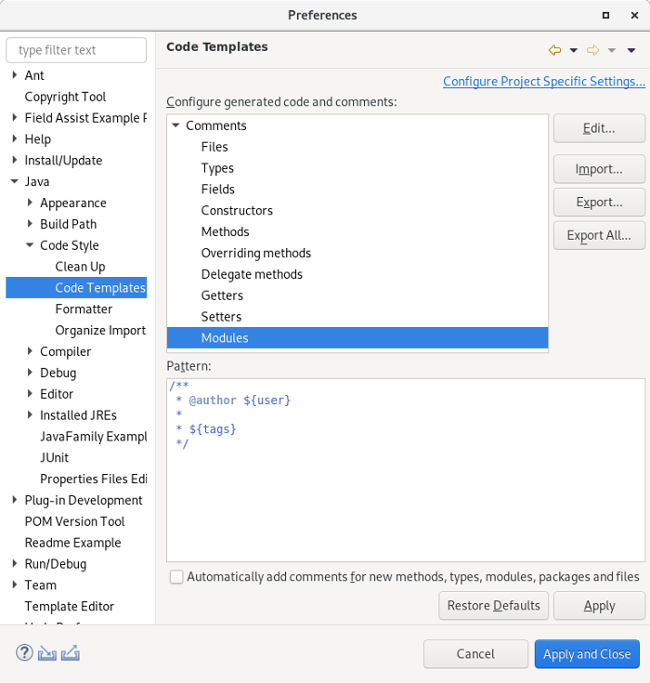
Adding a Javadoc comment to a Java module (module-info.java) will result in automatic annotations being added per the new module comment preferences.
The
directive will add $(tags)
and @uses
tags for all uses and provides
module statements.@provides
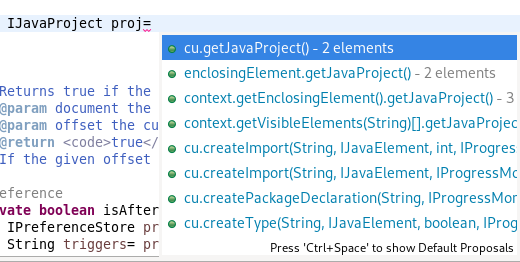
Code assist for "Chain Template Proposals" will be available. These will traverse reachable local variables, fields, and methods, to produce a chain whose return type is compatible with the expected type in a particular context.
The preference to enable the feature can be found in the Advanced sub-menu of the Content Assist menu group (Preferences > Java > Editor > Content Assist > Advanced) .
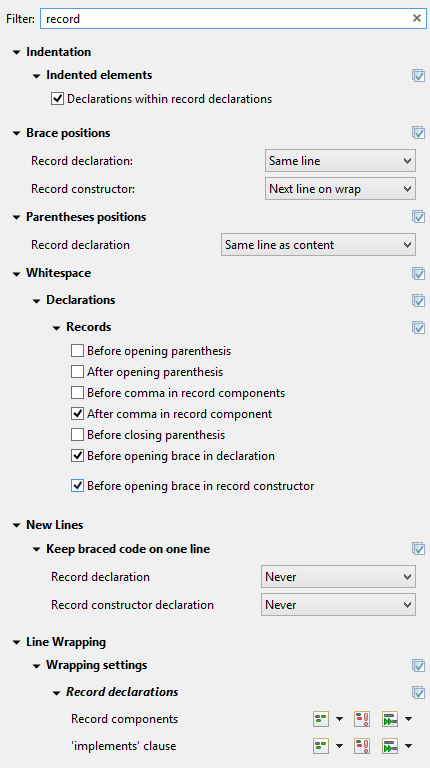
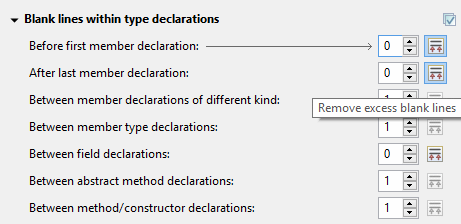
All the settings in the Blank lines section can now be configured to remove excess blank lines, effectively taking precedence over the Number of empty lines to preserve setting. Each setting has its own button to turn the feature on, right next to its number control. The button is enabled only if the selected number of lines is smaller than the Number of empty lines to preserve, because otherwise any excess lines are removed anyway.
There’s quite a lot of changes in the Blank lines section of the formatter profile.
Some of the existing subsections and settings are now phrased differently to better express their function:
The Blank lines within class declarations subsection is now Blank lines within type declaration
Before first declaration is now Before first member declaration
Before declarations of the same kind is now Between member declarations of different kind
Before member class declarations is now Between member type declarations
Before field declarations is now Between field declarations
Before method declarations is now Between method/constructor declarations
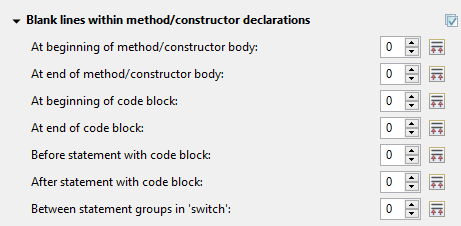
More importantly, a few new settings have been added to support more places where the number of empty lines can be controlled:
After last member declaration in a type (to complement previously existing Before first member declaration setting)
Between abstract method declarations in a type (these cases were previously handled by Between method/constructor declarations)
At end of method/constructor body (to complement previously existing At beginning of method/constructor body setting)
At beginning of code block and At end of code block
Before statement with code block and After statement with code block
Between statement groups in 'switch'
Most of the new settings have been put in a new subsection Blank lines within method/constructor declarations.
Manually changing the settings file .settings/org.eclipse.jdt.core.prefs of a project will result in a full project build, if the workspace auto-build is on. For example, pulling different settings from a git repository or generating the settings with a tool will now trigger a build. Note that this includes timestamp changes, even if actual settings file contents were not changed.
For the 4.13 release, it is possible to disable this new behavior with the VM property: -Dorg.eclipse.disableAutoBuildOnSettingsChange=true. It is planned to remove this VM property in a future release.
You can find more noteworthy updates in on this page.
JBoss Tools 4.12.0 and Red Hat CodeReady Studio 12.12 for Eclipse 2019-06 are here waiting for you. Check it out!
Red Hat CodeReady Studio comes with everything pre-bundled in its installer. Simply download it from our Red Hat CodeReady product page and run it like this:
java -jar codereadystudio-<installername>.jar
JBoss Tools or Bring-Your-Own-Eclipse (BYOE) CodeReady Studio require a bit more:
This release requires at least Eclipse 4.12 (2019-06) but we recommend using the latest Eclipse 4.12 2019-06 JEE Bundle since then you get most of the dependencies preinstalled.
Once you have installed Eclipse, you can either find us on the Eclipse Marketplace under "JBoss Tools" or "Red Hat CodeReady Studio".
For JBoss Tools, you can also use our update site directly.
http://download.jboss.org/jbosstools/photon/stable/updates/
Our main focus for this release was improvements for container based development and bug fixing. Eclipse 2019-06 itself has a lot of new cool stuff but let me highlight just a few updates in both Eclipse 2019-06 and JBoss Tools plugins that I think are worth mentioning.
With the new OpenShift Container Platform (OCP) 4 now available (see this article), even if this is a major shift compared to OCP 3, JBoss Tools is compatible with this major release in a transparent way. Just define your connection to your OCP 4 based cluster as you did before for an OCP 3 cluster, and use the tooling !
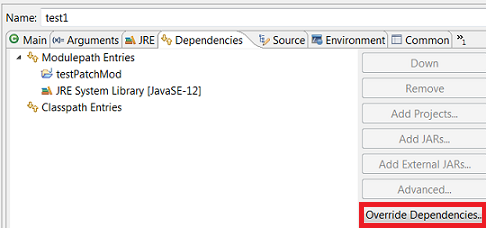
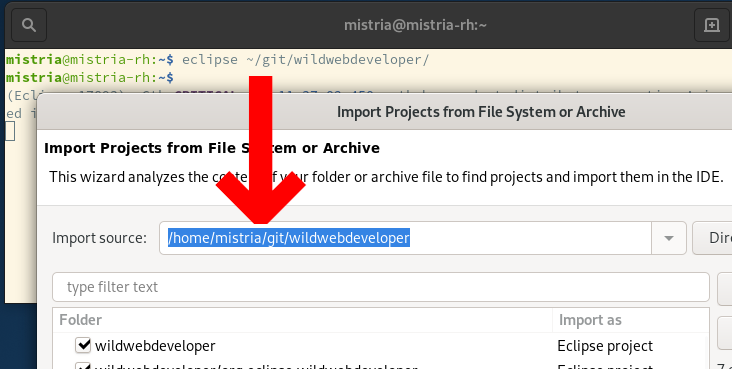
You can import a project into Eclipse by passing its path as a parameter to the
launcher. The command would look like
on Linux and Windows,
or eclipse /path/to/project
on macOS.open Eclipse.app -a /path/to/project
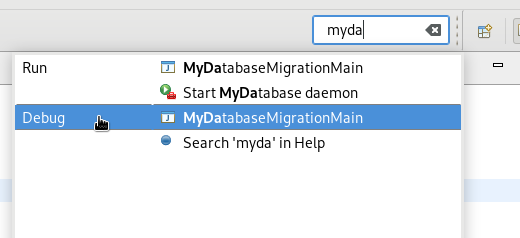
From the Quick Access proposals (accessible with
shortcut) you can now directly launch
any of the Run or Debug configurations available in your workspace.Ctrl+3
For performance reasons, the extra Quick Access entries are only visible if the
bundle was already activated by some previous action in the workbench such as editing a launch configuration,
or expanding the Run As… menus.
|
The icon used for the view menu has been improved. It is now crisp on high resolution displays and also looks much better in the dark theme.
Compare the old version at the top and the new version at the bottom:
On Mac, images and text are now drawn in high resolution during GC operations. You can see crisp images on high resolution displays in the editor rulers, forms, etc in Eclipse.
Compare the old version at the top and the new version at the bottom:
In dark theme on Mac, the Table and Trees in Eclipse now show the alternating dark lines
in the background when
is set. Earlier they had a gray background
even if line visibility was true.setLinesVisible(true)
Example of a Tree and Table in Eclipse with alternating dark lines in the background:
When the Equinox OSGi Framework is launched the installed bundles are activated according to their configured start-level. The bundles with lower start-levels are activated first. Bundles within the same start-level are activated sequentially from a single thread.
A new configuration option
has been added that enables
the framework to start bundles within the same start-level in parallel. The default value is equinox.start.level.thread.count
which keeps the previous behavior of activating bundles from a single thread.
Setting the value to 1
enables parallel activation using a thread count equal
to 0
. Setting the value to a number greater than Runtime.getRuntime().availableProcessors()
will use the specified number as the thread count for parallel bundle activation.1
The default is
because of the risk of possible deadlock when activating bundles in parallel.
Extensive testing must be done on the set of bundle installed in the framework before considering
enabling this option in a product.1
A quick fix Change project compliance and JRE to 12 is provided to change the current project to be compatible with Java 12.
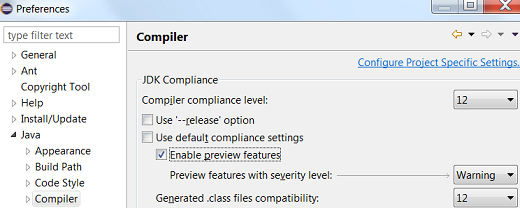
Preview features in Java 12 can be enabled using Preferences > Java > Compiler > Enable preview features option. The problem severity of these preview features can be configured using the Preview features with severity level option.
A quick fix Configure problem severity is provided to update the problem severity of preview features in Java 12.
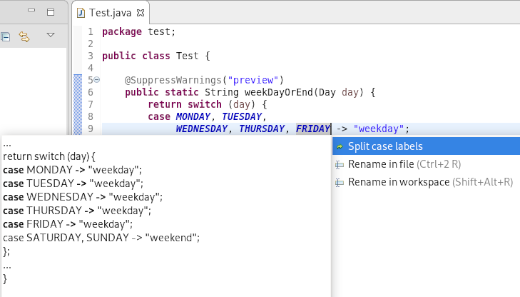
A quick fix Add 'default' case is provided to add default case to a enhanced switch statement in Java 12.
A quick fix Add missing case statements is provided for a enhanced switch statement in Java 12.
A quick fix Add 'default' case is provided to add default case to a switch expression.
A quick fix Add missing case statements is provided for switch expressions.
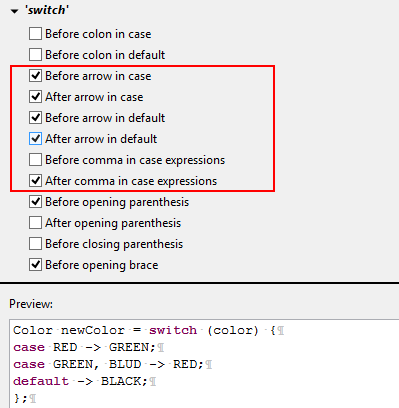
As Java 12 introduced some new features into the
construct, the formatter profile
has some new settings for it. The settings allow you to control spaces around the arrow operator
(separately for switch
and case
) and around commas in a multi-value case.default
The settings can be found in the Profile Editor (Preferences > Java > Code Style > Formatter > Edit…) under the White space > Control statements > 'switch' subsection.
In the Java > Editor > Code Mining preferences, you can now enable the Show parameter names option. This will show the parameter names as code minings in method or constructor calls, for cases where the resolution may not be obvious for a human reader.
For example, the code mining will be shown if the argument name in the method call is not an exact match of the parameter name or if the argument name doesn’t contain the parameter name as a substring.
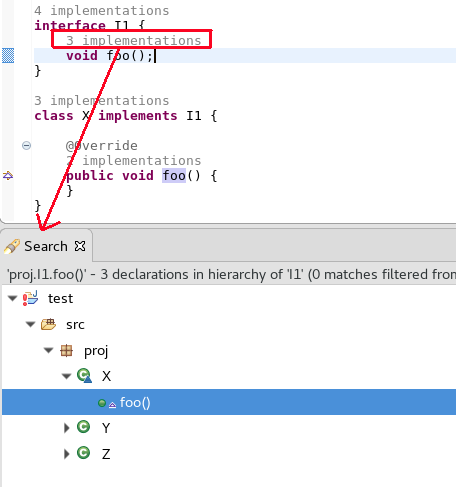
In the Java > Editor > Code Mining preferences, selecting Show implementations with the Show References (including implementations) for → Methods option now shows implementations of methods.
Clicking on method implementations brings up the Search view that shows all implementations of the method in sub-types.
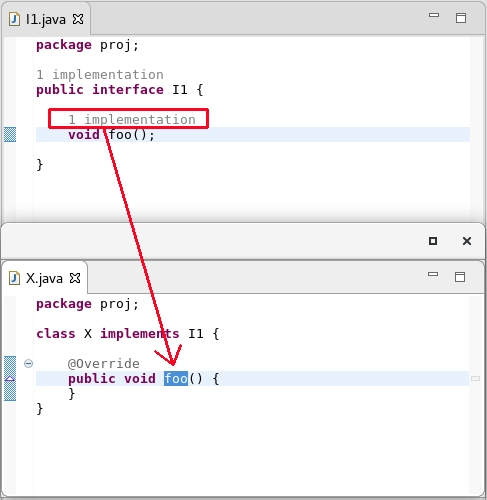
When the Java > Editor > Code Mining preferences are enabled and a single implementation or reference is shown, moving the cursor over the annotation and using Ctrl+Click will open the editor and display the single implementation or reference.
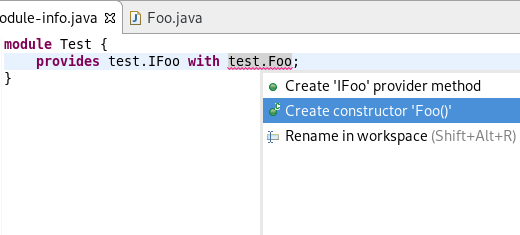
Appropriate quick fixes are offered when a service defined in a
file has a service provider
implementation whose no-arg constructor is not visible, or is non-existent.module-info.java
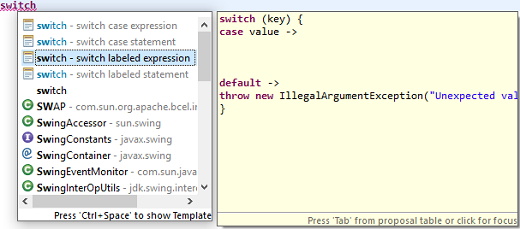
The Java Editor now offers new templates for the creation of switch labeled statements and switch expressions. On a switch statement, three new templates: switch labeled statement, switch case expression and switch labeled expression are available as shown below. These new templates are available on Java projects having compliance level of Java 12 or above.
If switch is being used as an expression, then only switch case expression and switch labeled expression templates are available as shown below:
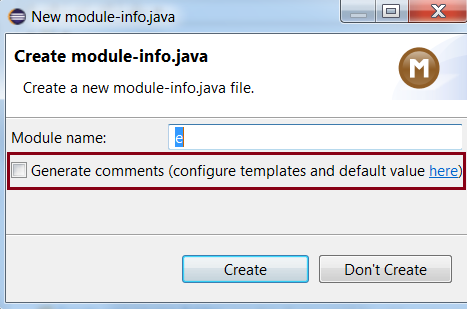
An option is now available to enable/disable the comment generation while
creating
or module-info.java
.package-info.java
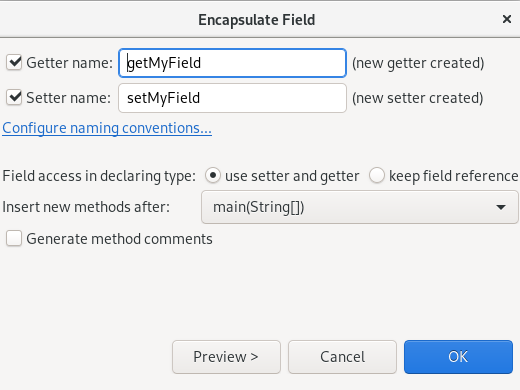
The quick assist for creating getter and setter methods from fields no longer forces you to create both.
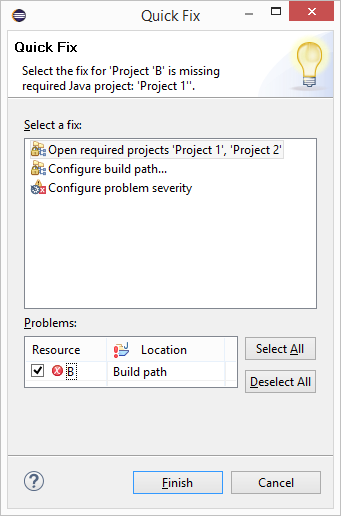
A quick fix to open all required closed projects is now available in the Problems view.
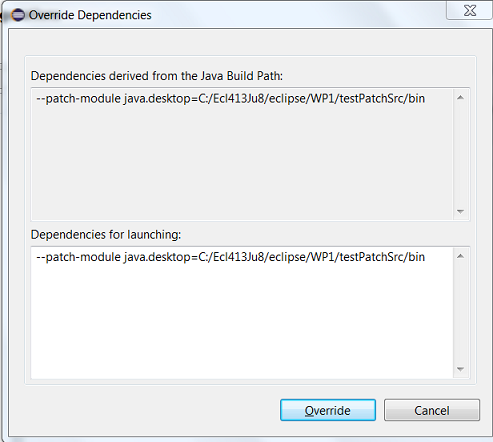
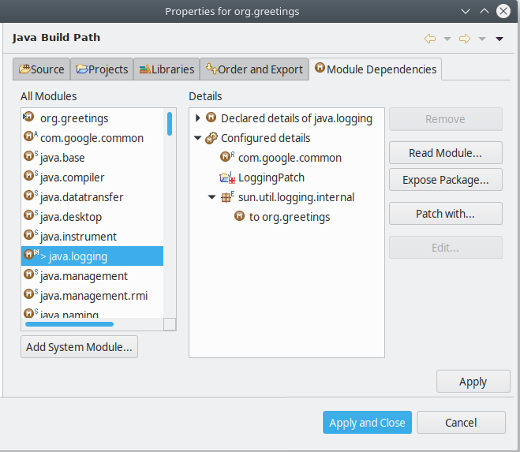
The Java Build Path configuration now has a new tab Module Dependencies, which will gradually replace
the options previously hidden behind the Is Modular node on other tabs of this dialog. The new tab provides
an intuitive way for configuring all those module-related options for which Java 9 had introduced new command
line options like
etc.--limit-modules
The dialog focuses on how to build one Java Project, here "org.greetings".
Below this focus module, the left hand pane shows all modules that participate in the build, where decorations
A and S mark automatic modules and system modules, respectively. The extent of system modules (from JRE)
can be modified with the Add System Module… and Remove buttons (corresponds to
and --add-modules
).--limit-modules
When a module is selected in the left hand pane, the right hand pane allows to configure the following properties for this module:
Read Module:
Select additional modules that should be accessible from the selected module (corresponds to
)--add-reads
Expose Package:
Select additional packages to be exposed ("exports" or "opens") from the selected module (corresponds
to
or --add-exports
)--add-opens
Patch with:
Add more packages and classes to the selected module (corresponds to
)--patch-module
Eclipse 4.7 introduced a new experimental Java index which was disabled by default.
Due to lack of resources to properly support all Java 9+ language changes, this index is not available anymore starting with Eclipse 4.12.
The preference to enable it in Preferences > Java is removed and the old index will be always used.
Preferences > Java > Rebuild Index button can be used to delete the existing index files and free disk space. |
A new shortcut, Ctrl+Alt+Click, has been added to the annotation ruler that will invoke the 'Run to Line' command and take the program execution to the line of invocation.
Content assist (Ctrl+Space) support is now available in the Debug Shell.
You can find more noteworthy updates in on this page.
Happy to announce 4.12.0.AM1 (Developer Milestone 1) build for Eclipse 2019-06.
Downloads available at JBoss Tools 4.12.0 AM1.
Full info is at this page. Some highlights are below.
Check out our new branding for Eclipse 2019-03. We’re now Red Hat CodeReady Studio 12 Integration Stack.
JBoss Tools Integration Stack 4.11.0.Final / Red Hat CodeReady Studio Integration Stack 12.11.0.GA
All of the Integration Stack components have been verified to work with the same dependencies as JBoss Tools 4.11 and Red Hat CodeReady Studio 12. |
DataVirtualization support from Teiid Designer is no longer available through the Integration Stack. It can be installed directly from Teiid Designer
This release has an updated BPMN2 Modeler and jBPM/Drools/KIE.
See the BPMN2 1.5.1.Final Known Issues Section of the Integration Stack 12.11.0.GA release notes.
See the Drools 7.21.0.Final Known Issues Section of the Integration Stack 12.11.0.GA release notes.
Red Hat CodeReady Studio Integration Stack is a set of Eclipse-based development tools. It further enhances the IDE functionality provided by Developer Studio, with plug-ins specifically for use when developing for other Red Hat products. It’s where BRMS tooling is aggregated. The following frameworks are supported:
Business Process and Rules Development plug-ins provide design, debug and testing tooling for developing business processes for Red Hat BRMS and Red Hat BPM Suite.
BPEL Designer - Orchestrating your business processes.
BPMN2 Modeler - A graphical modeling tool which allows creation and editing of Business Process Modeling Notation diagrams using graphiti.
Drools - A Business Logic integration Platform which provides a unified and integrated platform for Rules, Workflow and Event Processing including KIE.
jBPM - A flexible Business Process Management (BPM) suite.
Don’t miss the Features tab for up to date information on your favorite Integration Stack components.
The easiest way to install the Integration Stack components is through the stand-alone installer or through our JBoss Tools Download Site.
For a complete set of Integration Stack installation instructions, see Integration Stack Installation Guide
Let us know how it goes!
Paul Leacu.
JBoss Tools 4.11.0 and Red Hat CodeReady Studio 12.11 for Eclipse 2019-03 are here waiting for you. Check it out!
Red Hat CodeReady Studio comes with everything pre-bundled in its installer. Simply download it from our Red Hat CodeReady product page and run it like this:
java -jar devstudio-<installername>.jar
JBoss Tools or Bring-Your-Own-Eclipse (BYOE) CodeReady Studio require a bit more:
This release requires at least Eclipse 4.11 (2019-03) but we recommend using the latest Eclipse 4.11 2019-03 JEE Bundle since then you get most of the dependencies preinstalled.
Once you have installed Eclipse, you can either find us on the Eclipse Marketplace under "JBoss Tools" or "Red Hat CodeReady Studio".
For JBoss Tools, you can also use our update site directly.
http://download.jboss.org/jbosstools/photon/stable/updates/
Our main focus for this release was improvements for container based development and bug fixing. Eclipse 2019-03 itself has a lot of new cool stuff but let me highlight just a few updates in both Eclipse 2019-03 and JBoss Tools plugins that I think are worth mentioning.
When you need to defined a new OpenShift connection, you need to provide the following information:
cluster URL
username and password or token
If you’ve already logged in your cluster through the OpenShift Web Console, you can copy an oc
command
in the clipboard that contains both the cluster URL and your token.
So, from now, there is a new option that allows you to initialize the wizard fields from the copied oc
command:
Click on the Paste Login Command
button and the fields will be initialized:
A server adapter has been added to work with Wildfly 15. It adds support for Java EE 8.
Related JIRA: JBIDE-26502
The Filters and Customization… menu in Project Explorer now shows an additional User filters tab which can be used to exclude some resources from Project Explorer based on their name.
Full name and regular expressions are supported.
The Error Log view has been moved from the PDE project to the Platform project. See bug 50517 for details.
A copy to clipboard action has been added to all tabs of the Installation Details dialog.
The Environment tab in a Launch configuration dialog supports copy & paste actions now. The environment variables are transferred as text data, so it is not only possible to copy & paste between two different launch configurations, but also between the launch configuration and e.g. some text editor or the command line.
This feature is available in all launch configurations which use the common Environment tab.
When Eclipse IDE is started for the first time or with a new workspace, it may not be intuitive for new users on how to proceed. To help the users in getting started, the following useful links have been provided to add a project to the workspace:
Perspective specific project creation wizard
Generic New Project wizard
Import projects wizard
The Dark theme for Mac has been improved to use the colors from the macOS system dark appearance. Some of the notable changes in Eclipse IDE are the dark window title bar, menus, file dialogs, combos and buttons.
Note: This change is available on macOS Mojave and later.
Before:
After:
Java 12 is out and Eclipse JDT supports Java 12 for 4.11 via Marketplace. The release notably includes the following Java 12 feature: JEP 325: Switch Expressions (Preview). Please note that this is a preview language feature and hence enable preview option should be on. For an informal introduction of the support, please refer to Java 12 Examples wiki.
JUnit 5.4 is here and Eclipse JDT has been updated to use this version.
Instead of a single line wrapping setting for binary expressions, there’s now a whole section of settings for various kinds of binary operators (multiplicative, additive, logical, etc.). There are settings for relational (including equality) and shift operators, which were not covered by the old setting. Also, string concatenation can now be treated differently from arithmetic sum.
The settings can be found in the Profile Editor (Preferences > Java > Code Style > Formatter > Edit…) under the Line Wrapping > Wrapping settings > Binary expressions subsection.
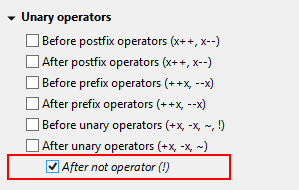
The white space around operators in binary expressions can now be controlled separately for different groups of operators, consistent with the line wrapping settings.
The new Binary operators sub-section has been added under White Space > Expressions in the Formatter profile editor.
A chain of nested conditional expressions (using ternary operator) can be now wrapped as a single group, with all of them indented at the same level. It’s only possible for right-sided nesting.
Find the Chained conditionals setting in the Profile Editor under the Line Wrapping > Wrapping settings > Other expressions subsection.
The Formatter Profile has a new setting that indents wrapped Javadoc tag descriptions.
It’s called Indent other tag descriptions when wrapped, in contrast to the preexisting Indent wrapped
@param/@throws descriptions setting. It affects tags like
or @return
.@deprecated
The settings can be found in the Profile Editor (Preferences > Java > Code Style > Formatter > Edit…) under the Comments > Javadocs section.
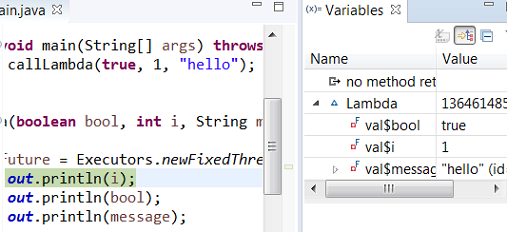
The Variables view now stores a history of the expressions used in the Detail pane. You can choose a previously entered expression for a variable from the new drop-down menu. The expression will be copied to the Detail pane where you can select it to perform various actions present in the context menu.
You can find more noteworthy updates in on this page.