What's New in 4.4.0.Final
Docker Tools
Dockerfile Editor
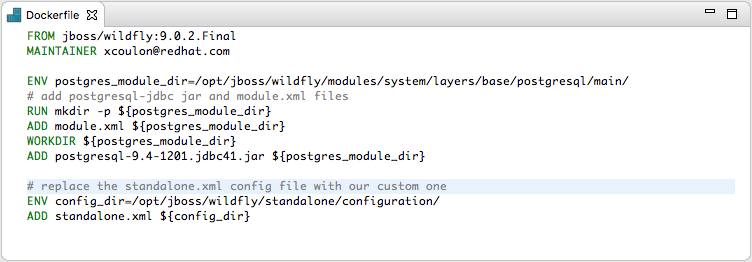
This is an awesome, external contribution, brought by Tobias Verbeke and his team from Open Analytics. The Dockerfile Editor provides users with content assist on the commands (ADD, COPY, RUN, etc.) as well as a customizable syntax highlighting.
Executing shell in a container
When running a container, users can execute shell commands from the Terminal view.
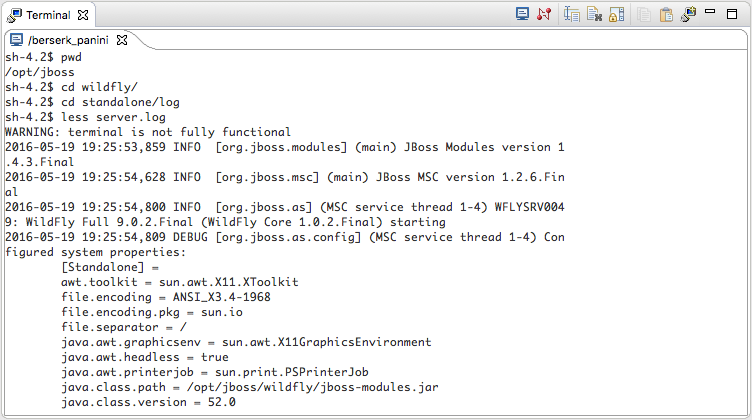
The context menu is available in the Docker Containers view and will be available in the Docker Explorer view too in the next release.
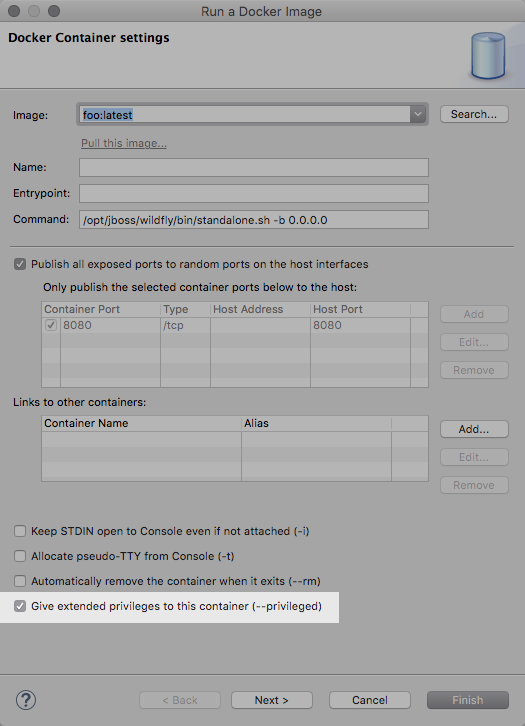
Running privileged containers
Containers can be run with the --privileged flag,
which gives them extended privileges, such as accessing all devices, and allowing them nearly
all the same access to the host as regular processes running on the host (i.e., not in containers).
Supporting disconnections
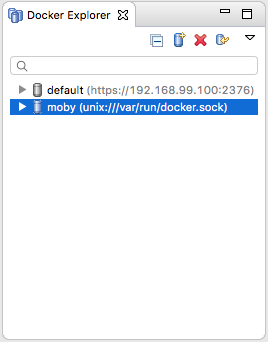
Sometimes the Docker instances that were configured in Eclipse are not running anymore (the Docker Machine were stopped, for example). In that case, the Docker Explorer view will display a different decorator for those connections, and an "Enable connection" button in the toolbar will let the user reconnect.
Push images to registries with authentication
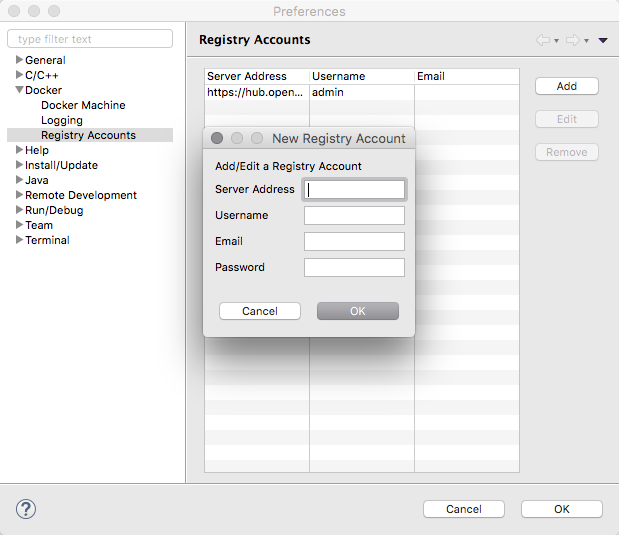
Docker images can be pushed to registries with support for authentication. A preference page will let the user configure the Docker registries connection settings, including the credentials to use.
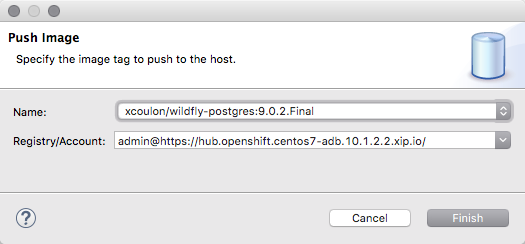
The "Push Image" wizard lets the user select the target registry and then takes care of tagging the image with the registry location before performing the push operation.
Edit configuration
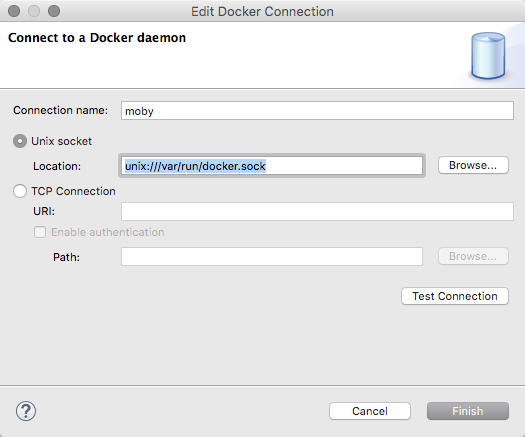
Users can now edit the connection settings instead of having to remove and re-create a connection when the settings changed (this can happen when the IP address allocated to a Docker Machine changed upon restart)
Improved support for disconnections
We’ve kept working on the support for disconnections and the Docker Explorer view now hides the expand button and changes the icon to a gray color when the connection to the Docker daemon is lost. Users can still edit the connection and use the 'Enable' button in the toolbar to re-establish the connection when the target Docker daemon is back in a running state.
Forge Tools
Forge Runtime updated to 3.2.2.Final
The included Forge runtime is now 3.2.2.Final. Read the official announcement here.
JavaScript Tools
EcmaScript 2015
An important part of rebooting the JavaScript Development Tools (JSDT) project was updating the JavaScript language level supported with JSDT. Obsolete parser/compiler tool chain was replaced with esprima parser that supports the ECMAScript 2015 (ES6) which is the latest JavaScript specification release at this time:
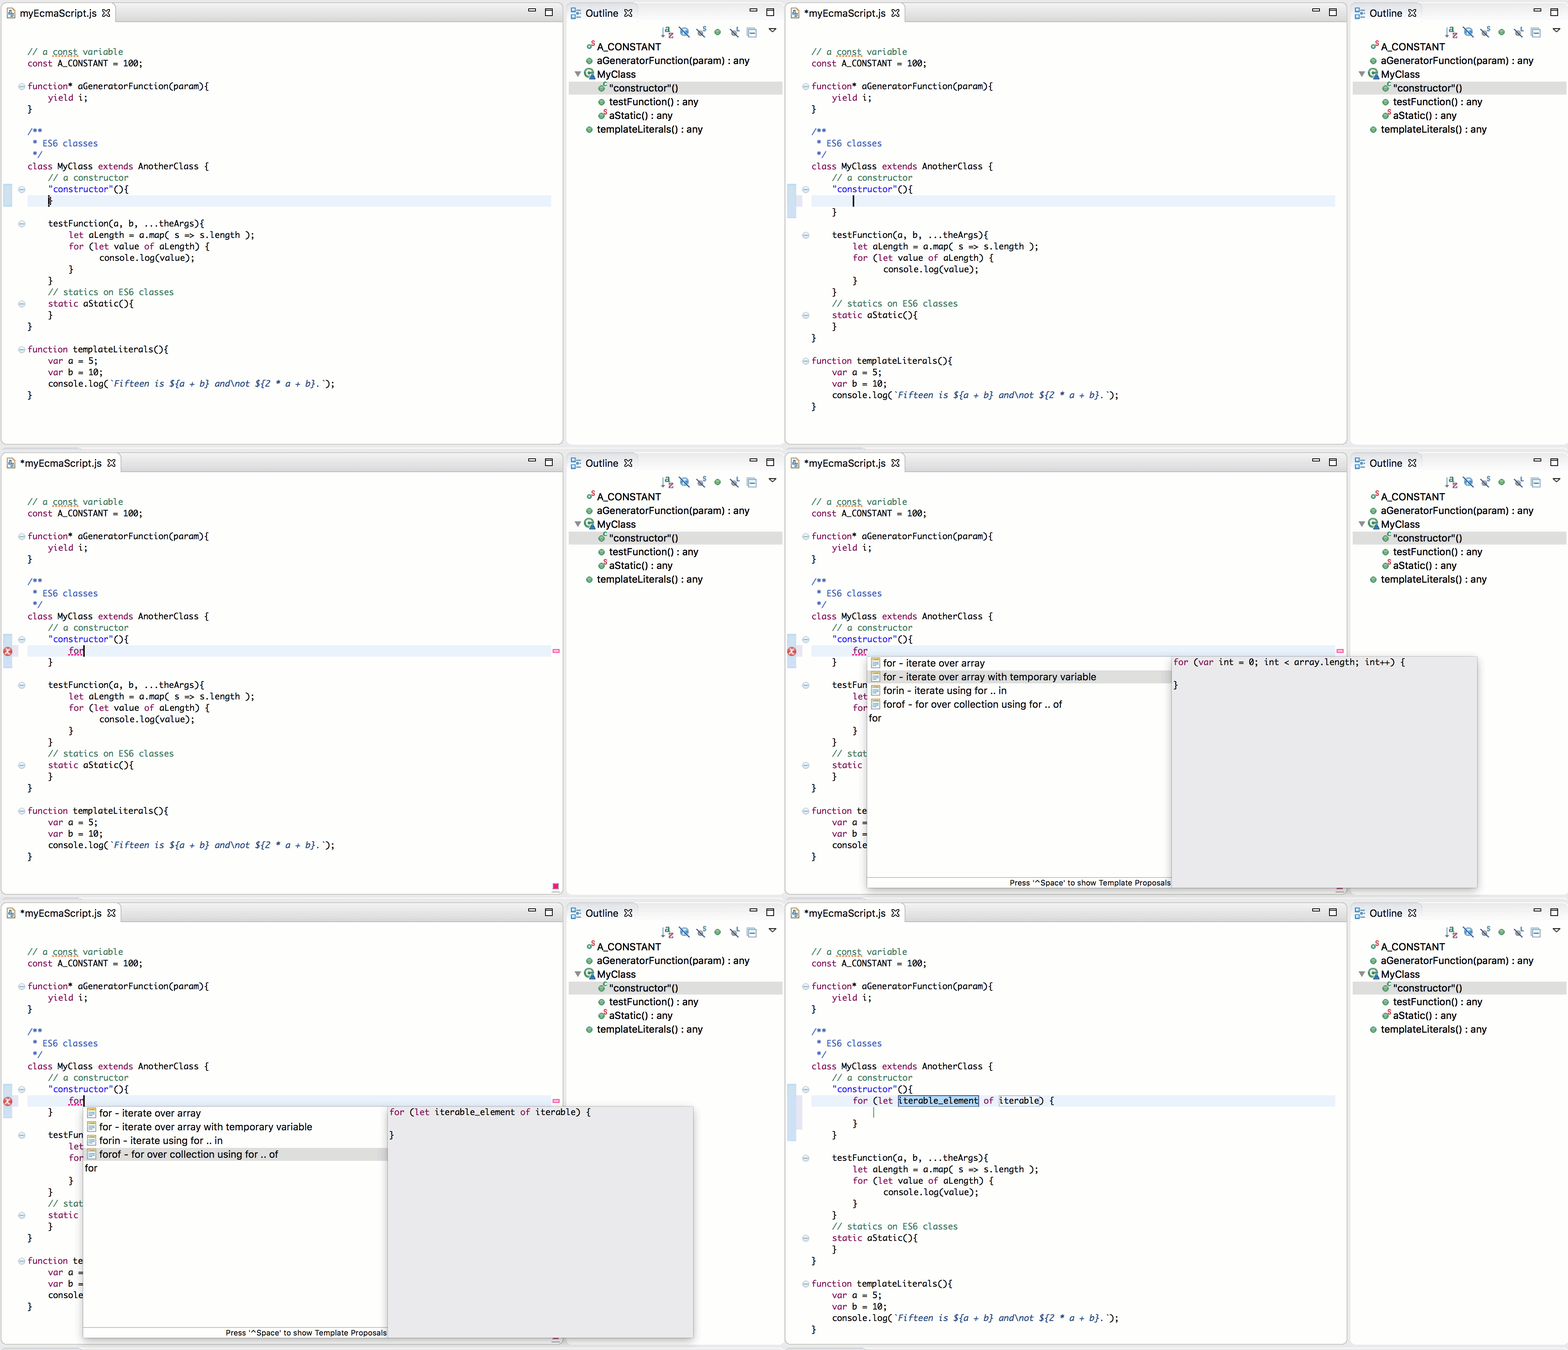
More information about EcmaScript 2015 improvements can be found in the Eclipse may newsletter article JSDT, meet EcmaScript 2015
Node.js Support
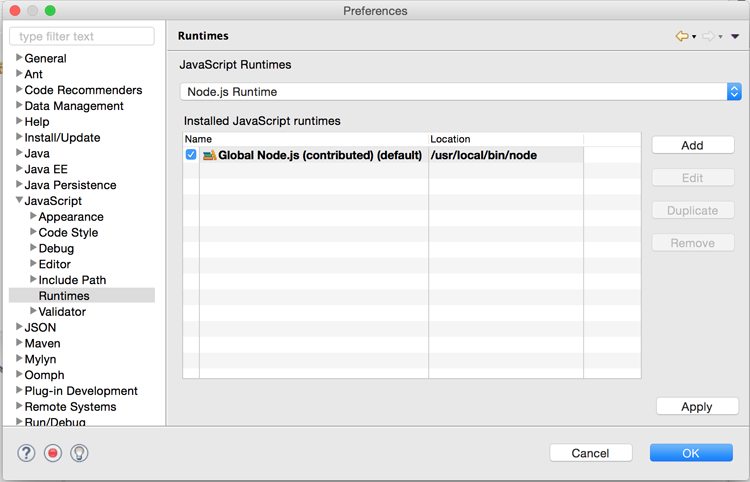
Node.js runtime definition is now available via Eclipse Preferences → JavaScript → Runtimes:
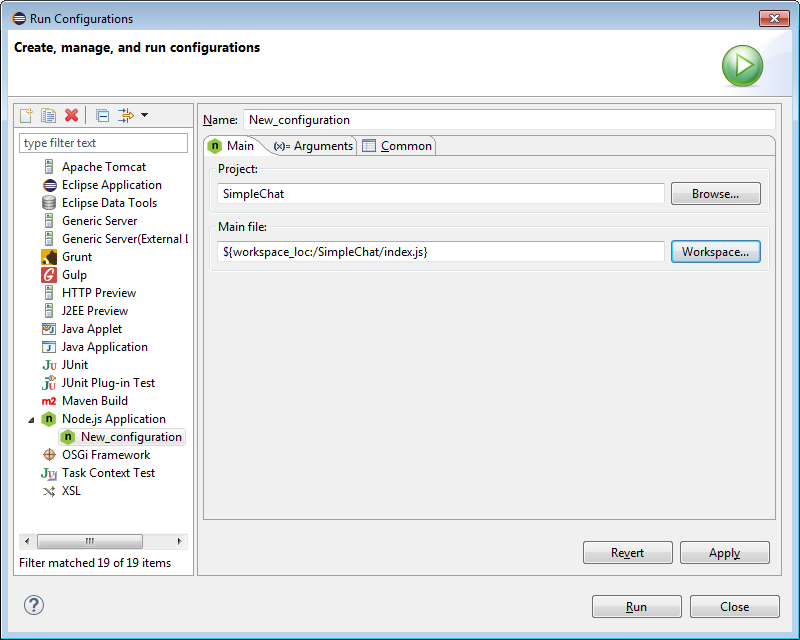
Also there is a new Node Launch configuration for running / debugging Node.js applications:
The process of debugging has been significantly improved. Now all debugging happens directly in the JSDT editor:
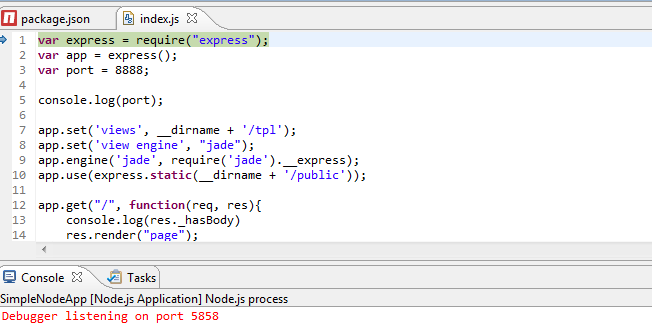
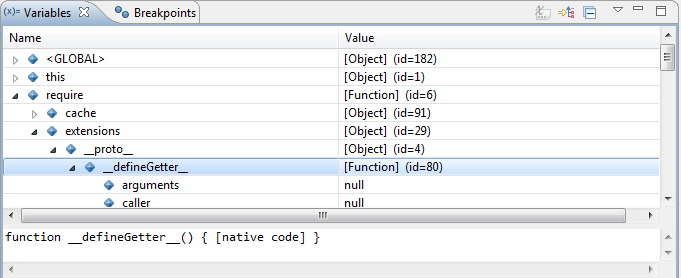
While debugging, all JavaScript variables will be available in the Variables view:
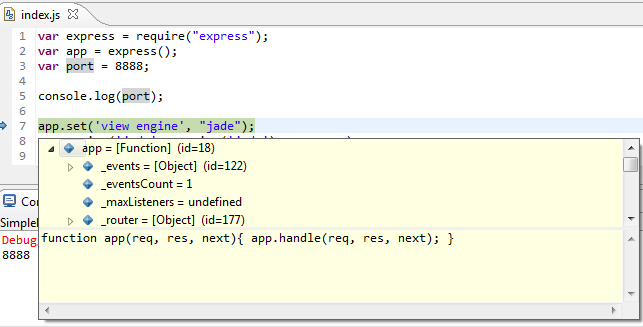
Hovering over variables in the editor is also supported:
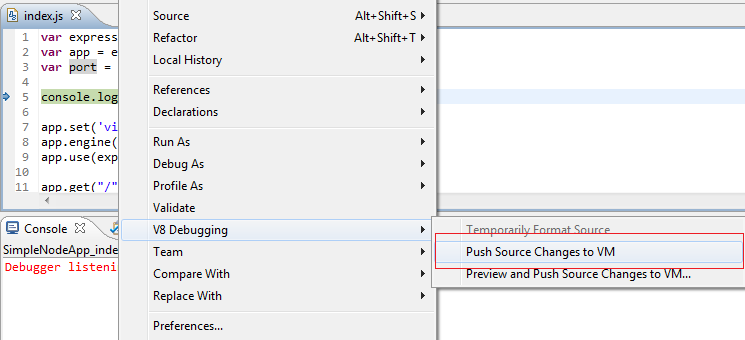
Live Edit functionality is supported via V8 Debugging → Push Source Changes to VM menu items:
More information about Node.js improvements can be found in the Eclipse may newsletter article Neon and Node.js: A magical friendship!
Grunt / Gulp Support
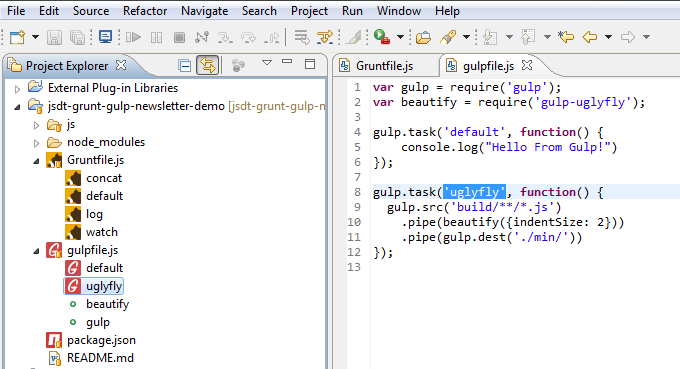
Now all tasks defined in the Gruntfile.js / gulpfile.js are available in the Project Explorer view:
Running a task is supported via → Run As → Gulp / Grunt Task menu:
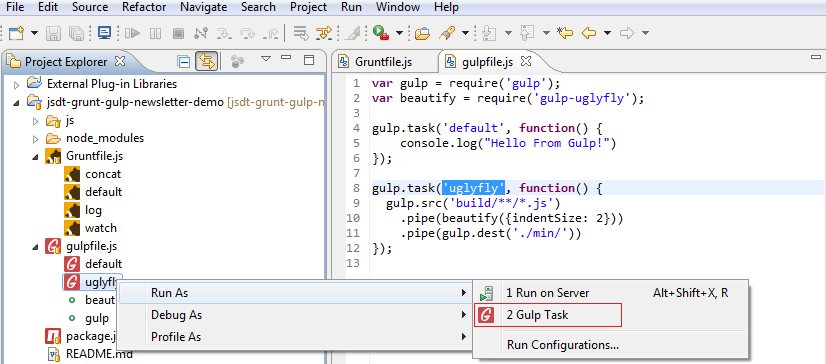
More information about JavaScript task runners can be found in the Eclipse may newsletter article Next station: Grunt and Gulp Automation!
Demo
Here is a short video which demonstrates new features and enhancements of JSDT 2.0 release:
JSON Editor
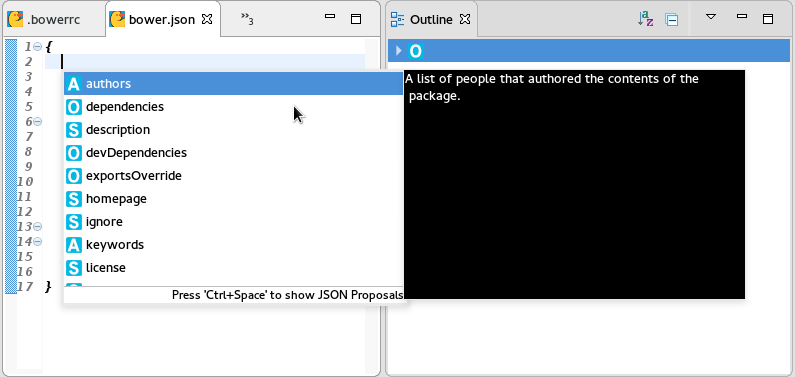
New editor is available for mastering JSON files: JSON Editor. This Editor is a part of Eclipse Web Tools and available in the latest Eclipse Neon release.
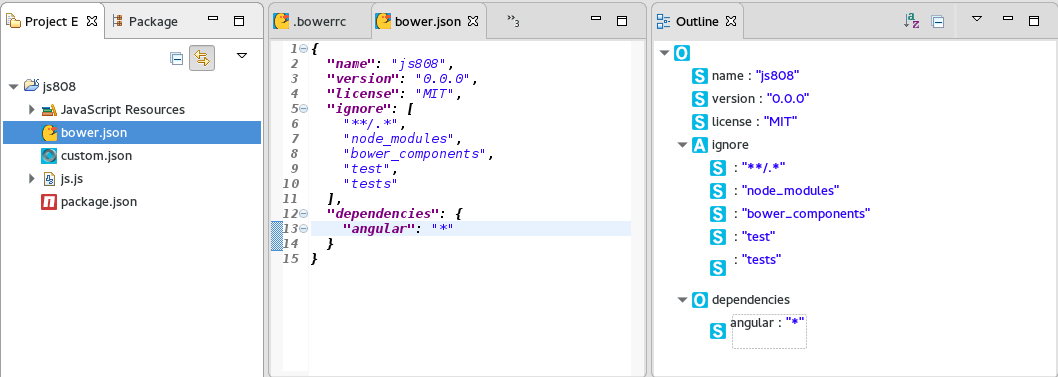
Validation and content assisting are available for the following well-known JSON files: * bower.json * .bowerrc * package.json * .jshintrc
JBoss Central
New EAP 7 quickstarts
Red Hat Central now lists quickstarts targeting the newly released Red Hat JBoss Enterprise Application 7.0 server.
Related JIRA: JBIDE-22459
OpenShift
Deploy docker images to the CDK OpenShift registry
The New OpenShift Connection wizard now supports setting a Docker registry url in the advanced properties section:
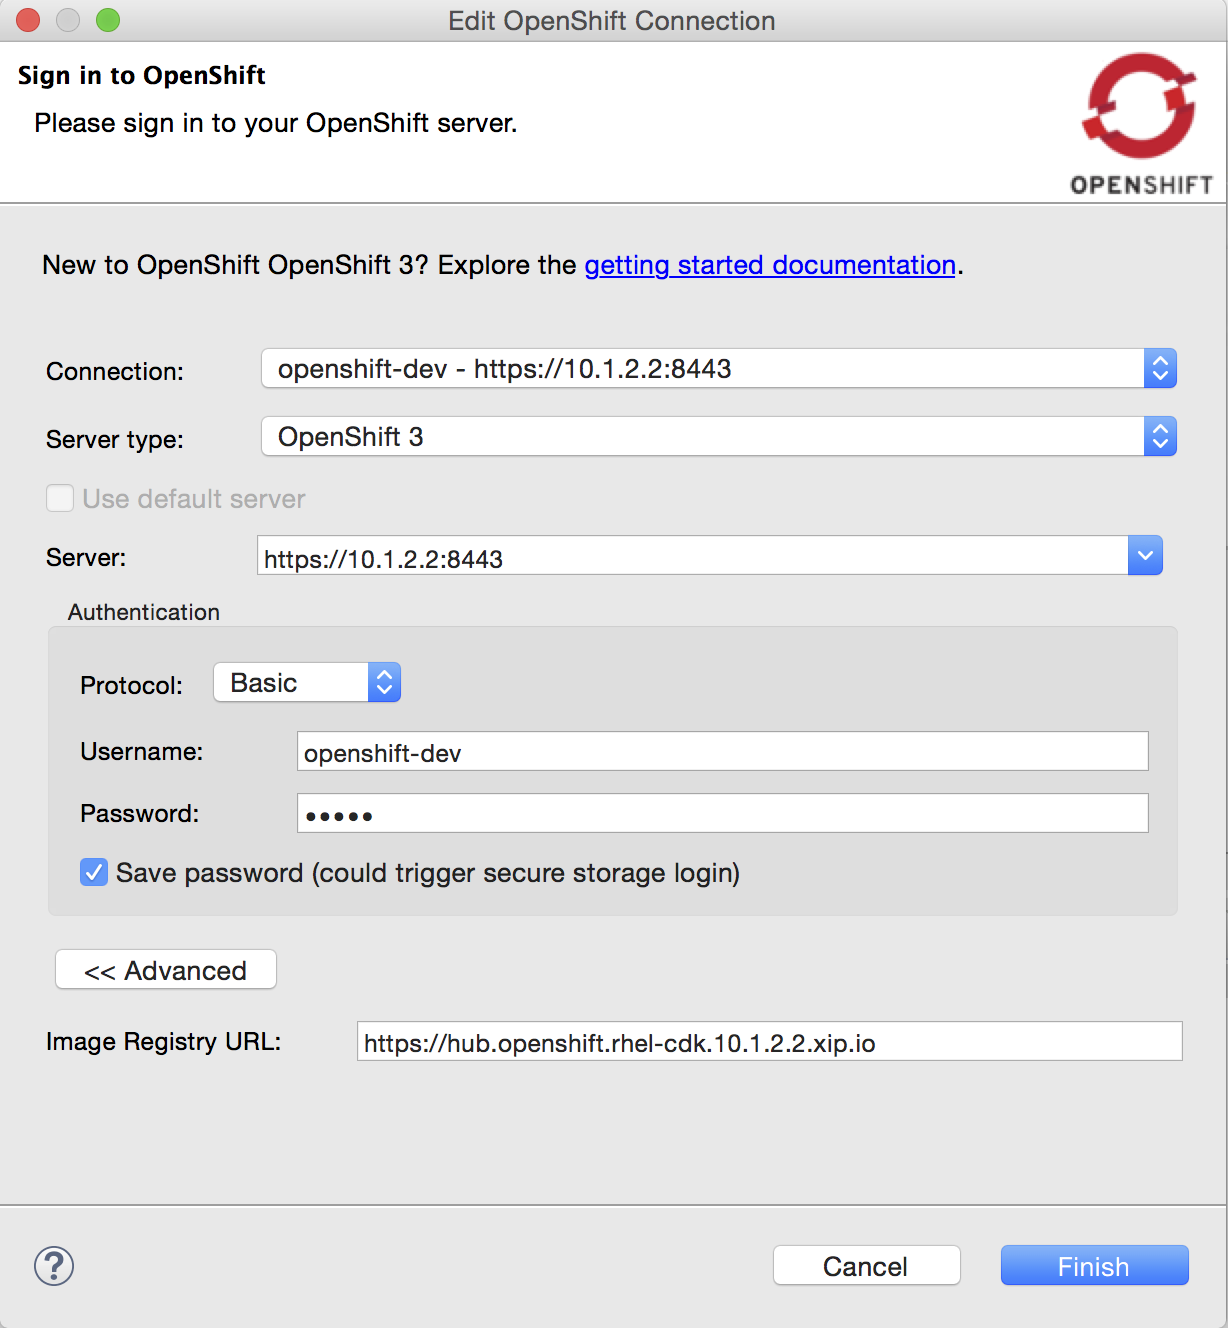
This allows you to push docker images to the given Docker registry via the Deploy Docker Image wizard, right before actually creating the OpenShift resources.
When using the OpenShift instance from Red Hat’s Container Development Kit, you must select the Container Development Environment Docker Connection. The username and password (actually the OpenShift token, as per this documentation) are already preset for you.
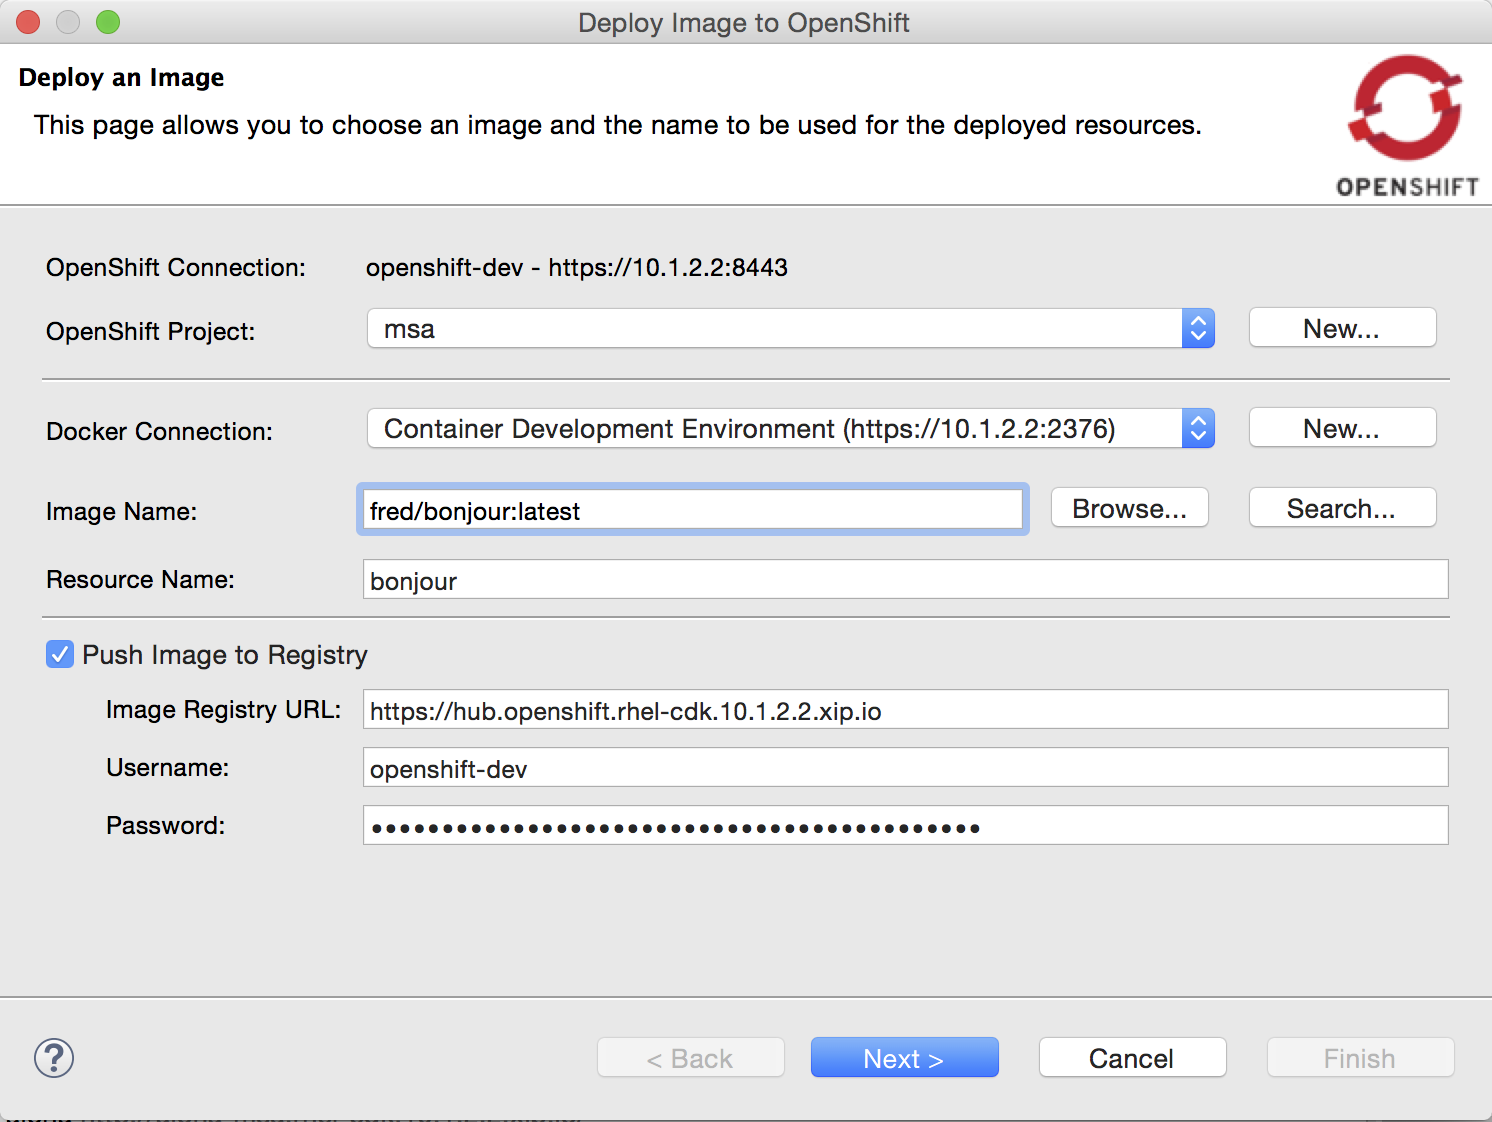
If the CDK docker connection has a new version of the Docker image, it can be pushed again via the same mechanism.
Related JIRA: JBIDE-22193
Delete multiple projects
The OpenShift Explorer now supports deleting multiple OpenShift projects at once, via the Delete Project… menu

Related JIRA: JBIDE-21420
Route created by default
A route is now created by default when creating a new application from a builder image or when deploying a docker image:
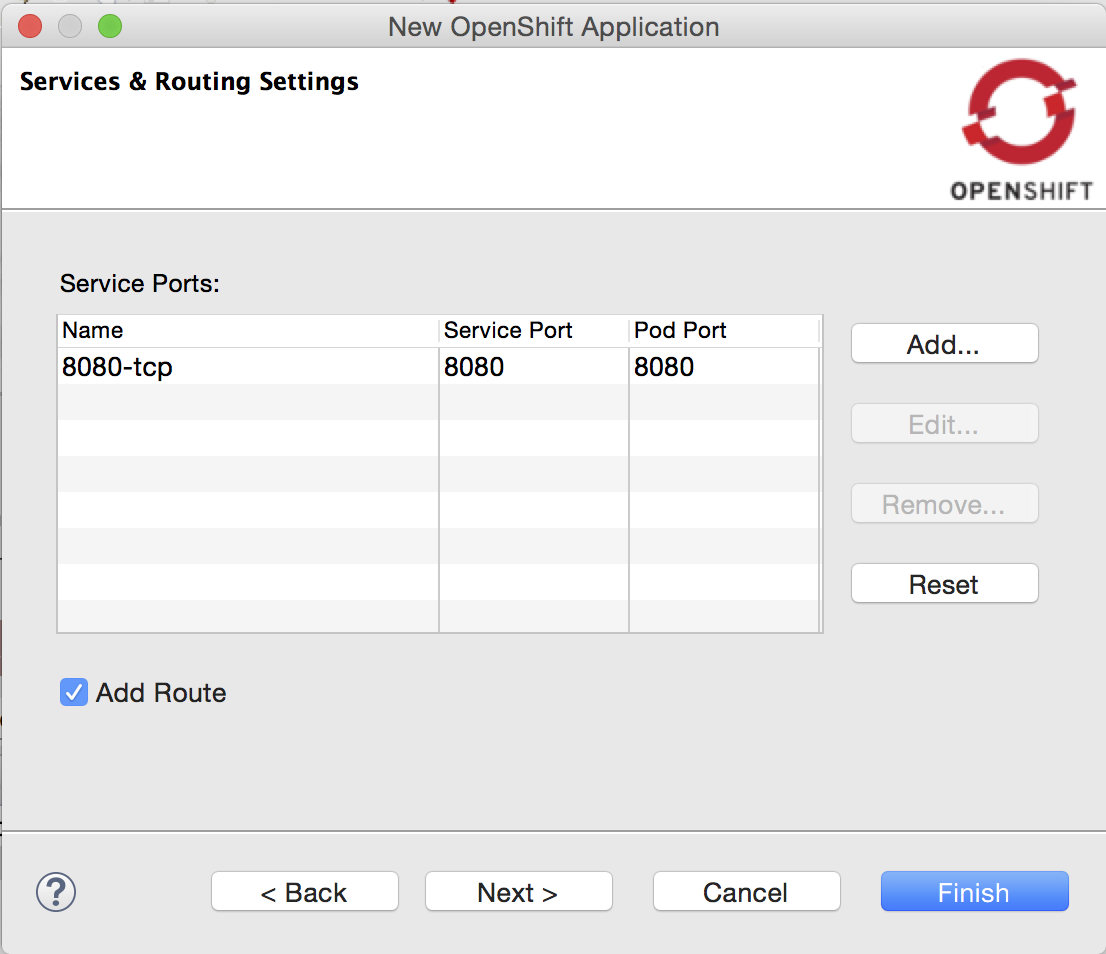
You can uncheck the Add Route checkbox, if creating a route to your service is irrelevant to your use case.
Related JIRA: JBIDE-22165
Improved OpenShift 3 support
New support for builder images
The New OpenShift Application wizard now supports builder images, on top of the existing template support:
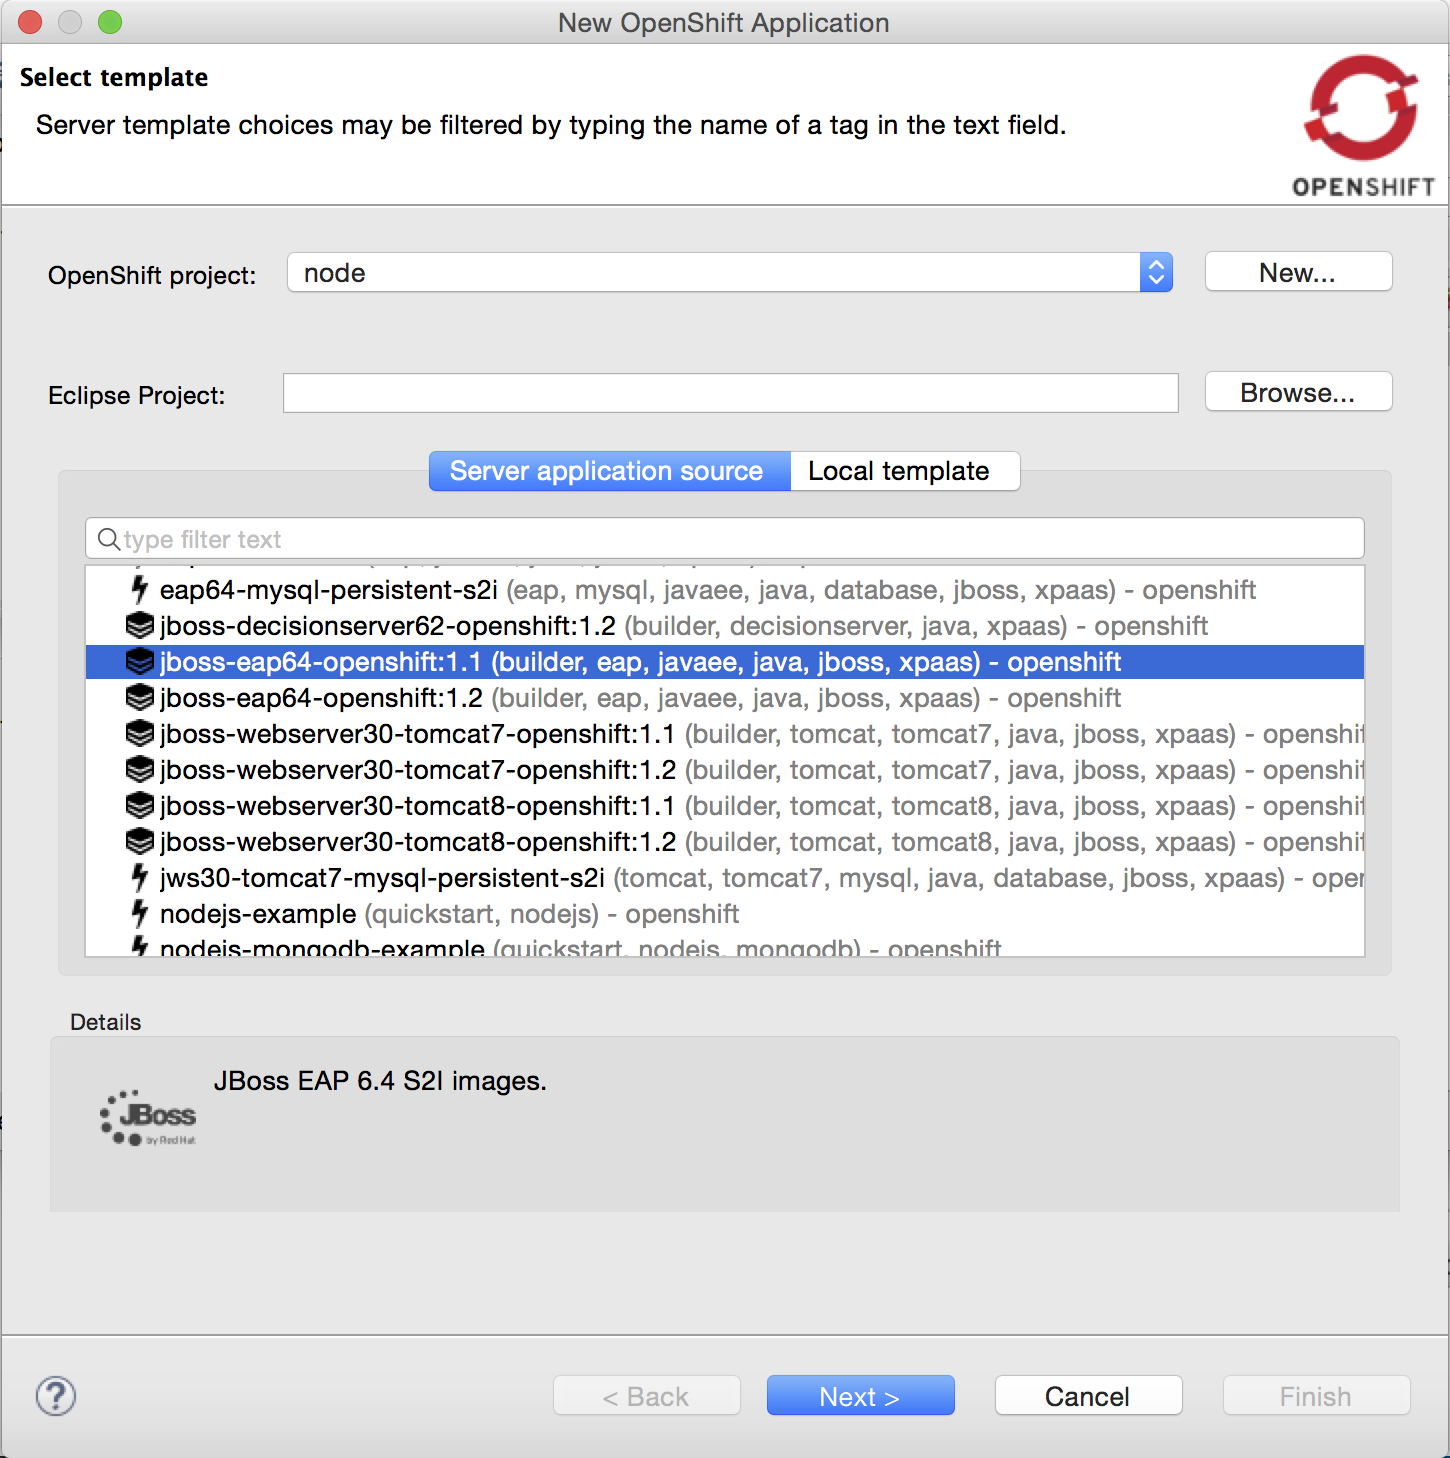
Compared to regular templates, with the builder image-based workflow, users will be able to define:
-
git source url
-
build triggers
-
environment variables
-
data volumes
-
replicas
-
exposed service ports and routes
Related JIRA: JBIDE-22118
Create new resources
The OpenShift Explorer now provides a New > Resource menu, that lets you create new OpenShift resources from an existing file, similar to the oc create -f some_resource.json command.
Resource files can be local (from File System or Workspace), or remote, by providing a URL.
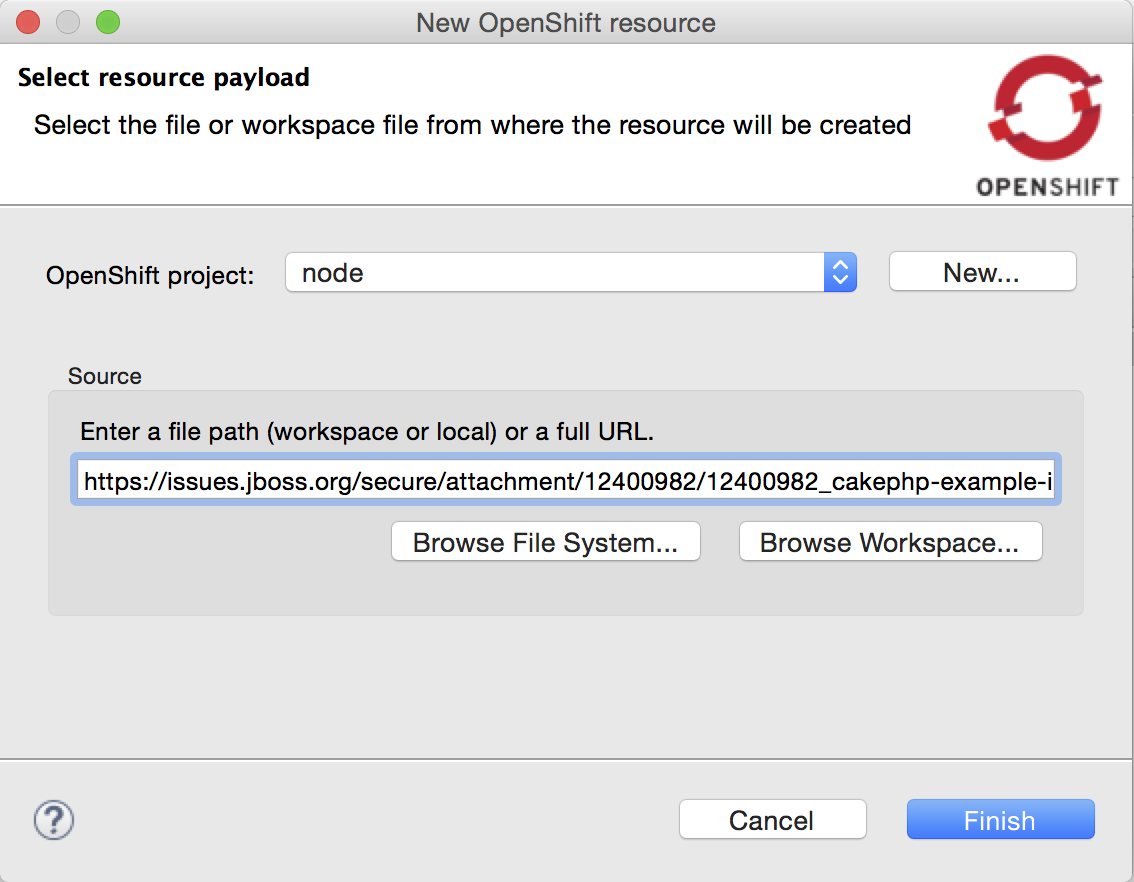
Once the file is uploaded and processed by the OpenShift server, a summary dialog will display the list of all the resources that have been created.
Related JIRA: JBIDE-20937
Scaling pods
It is now possible to scale pods up and down, from the Service context menu in the OpenShift Explorer, or the Deployments and Deployment Configuration context menus in the Properties view.
Scale > Up will spin up one more pod, Scale > Down will remove one pod. Scale > To… will open a pop-up dialog to let you set the amount of pods you want your OpenShift to spin up.
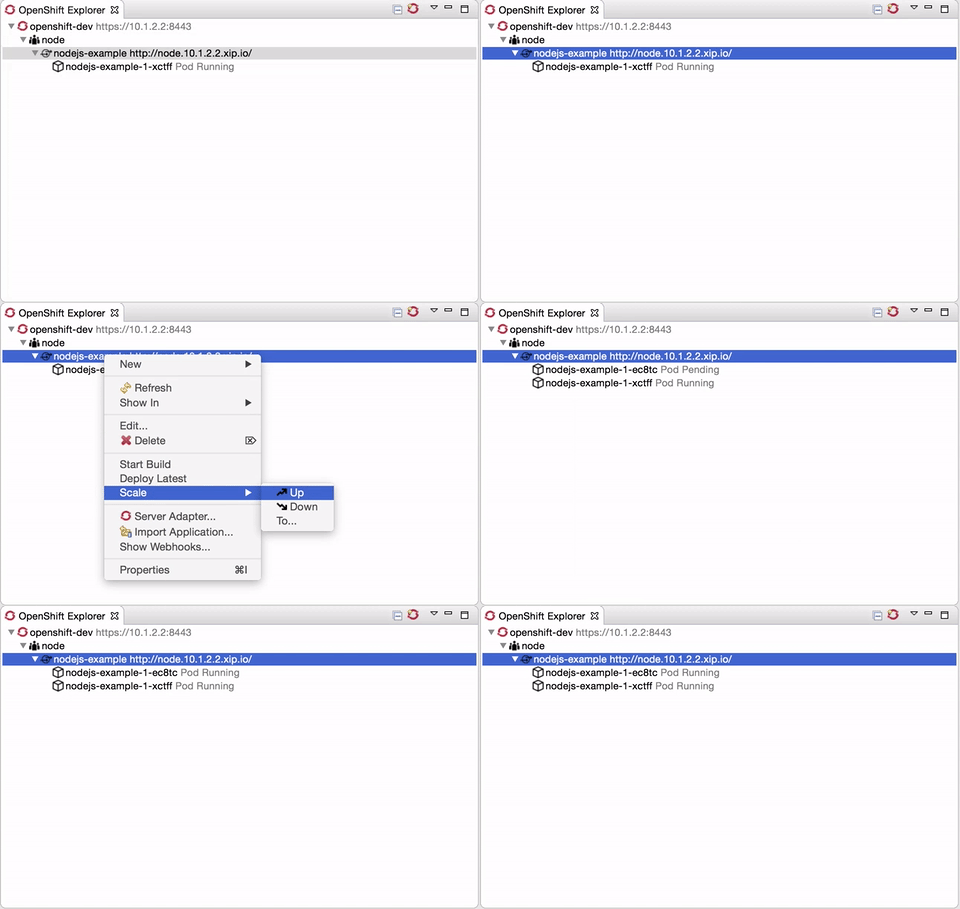
Related JIRA: JBIDE-21634
Create application from remote template
The new OpenShift 3 Application wizard now supports URLs, when using a custom template.
Related JIRA: JBIDE-22190
Automatically select OAuth token
When creating a new OpenShift 3 connection in OAuth mode, an integrated browser opens, to connect to the Openshift instance. The OAuth token displayed on the page is now automatically copied and pasted to the token field of the connection wizard, once the browser is closed.
Related JIRA: JBIDE-22360
Server Tools
Allow setting exploded or zipped setting on a per-module basis
In the past, the decision of whether to explode or package up a project for deployment was made as a setting on the entire server. This setting would be respected for all top level modules, and for most nested modules (for example, a Web project nested inside a EAR Project would also be exploded if the EAR was exploded). The server-wide setting was not 100% respected at all times, though. Specifically, even if the server-wide setting was to explode deployments, in some cases, nested utility jars would still be zipped, depending on the server type and its support for exploded Utility jars.
Users requested a more fine-grained control over which of their projects would be exploded or packaged. To help, we’ve added a new column to the per-module settings section of the deployments tab of the server editor. This will allow users more flexibility and certainty when deciding how specific projects should be packaged.
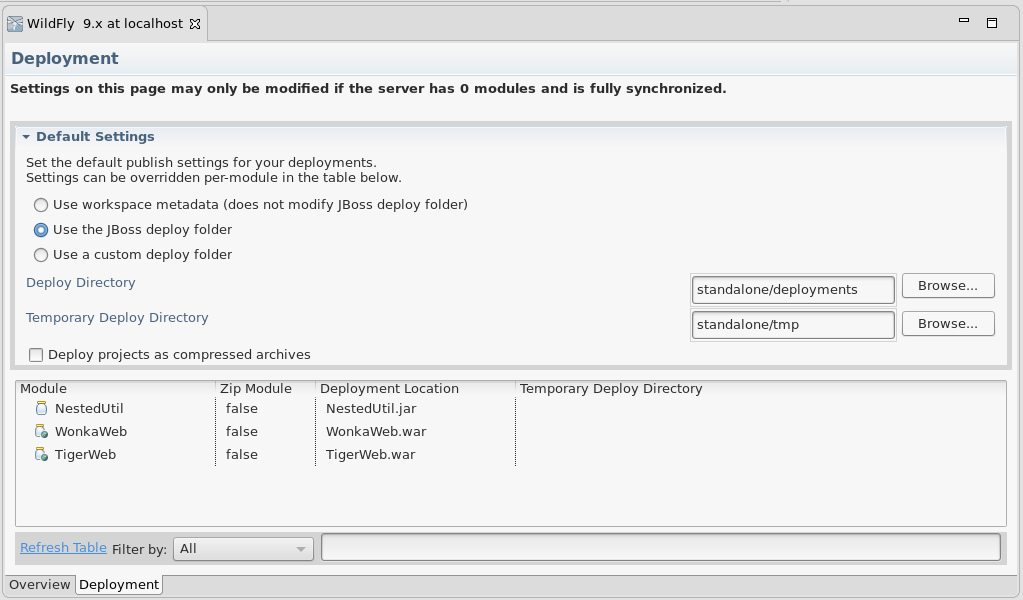
Related JIRA: JBIDE-20577 - Allow setting exploded or zipped on per-module basis
Starting remote servers will now connect remote debugger
When creating a new server in JBossTools, you are provided the option of using a local framework or a remote framework to manage it. When choosing the remote option, JBossTools will now helpfully add debug JVM options to the startup command when you right-click your server and select 'debug'. Then, it will automatically launch a 'Remote Java Application' launch to connect the eclipse debugger to your remote application server.
There are, of course, some limitations. We will only automatically add the debug JVM options if you have not customized the launch script at all. You can see below where you would override our default command to launch against a remote server. As long as 'Automatically Calculate' is checked, we will add the flags when you start the server in debug mode.
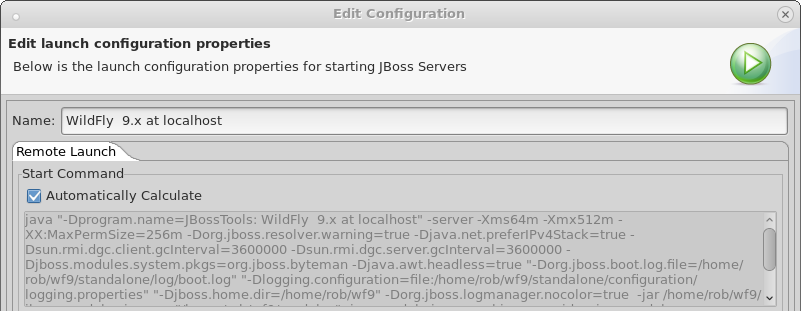
However, you will not see the added flags in the text field shown. The reason for this is that since we only add those flags when launched in debug mode, it is inappropriate for us to show them in the general launch configuration UI, since they may or may not be included in the remote command.
New UI has also been added to the Server Editor’s 'Ports' section to allow you to customize which port to use when exposing the debug port, and to also use when launching the remote debugger. This new UI is shown below.
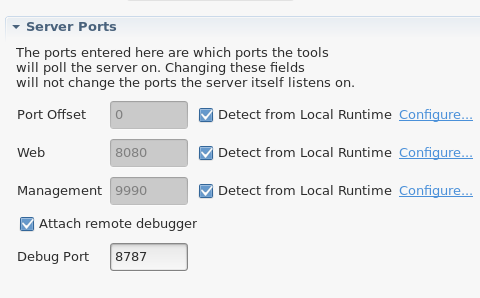
Related JIRA: JBIDE-9442 - Investigate possibility for remote debug launch of app servers