What's New in 4.4.2.Final
Forge Tools
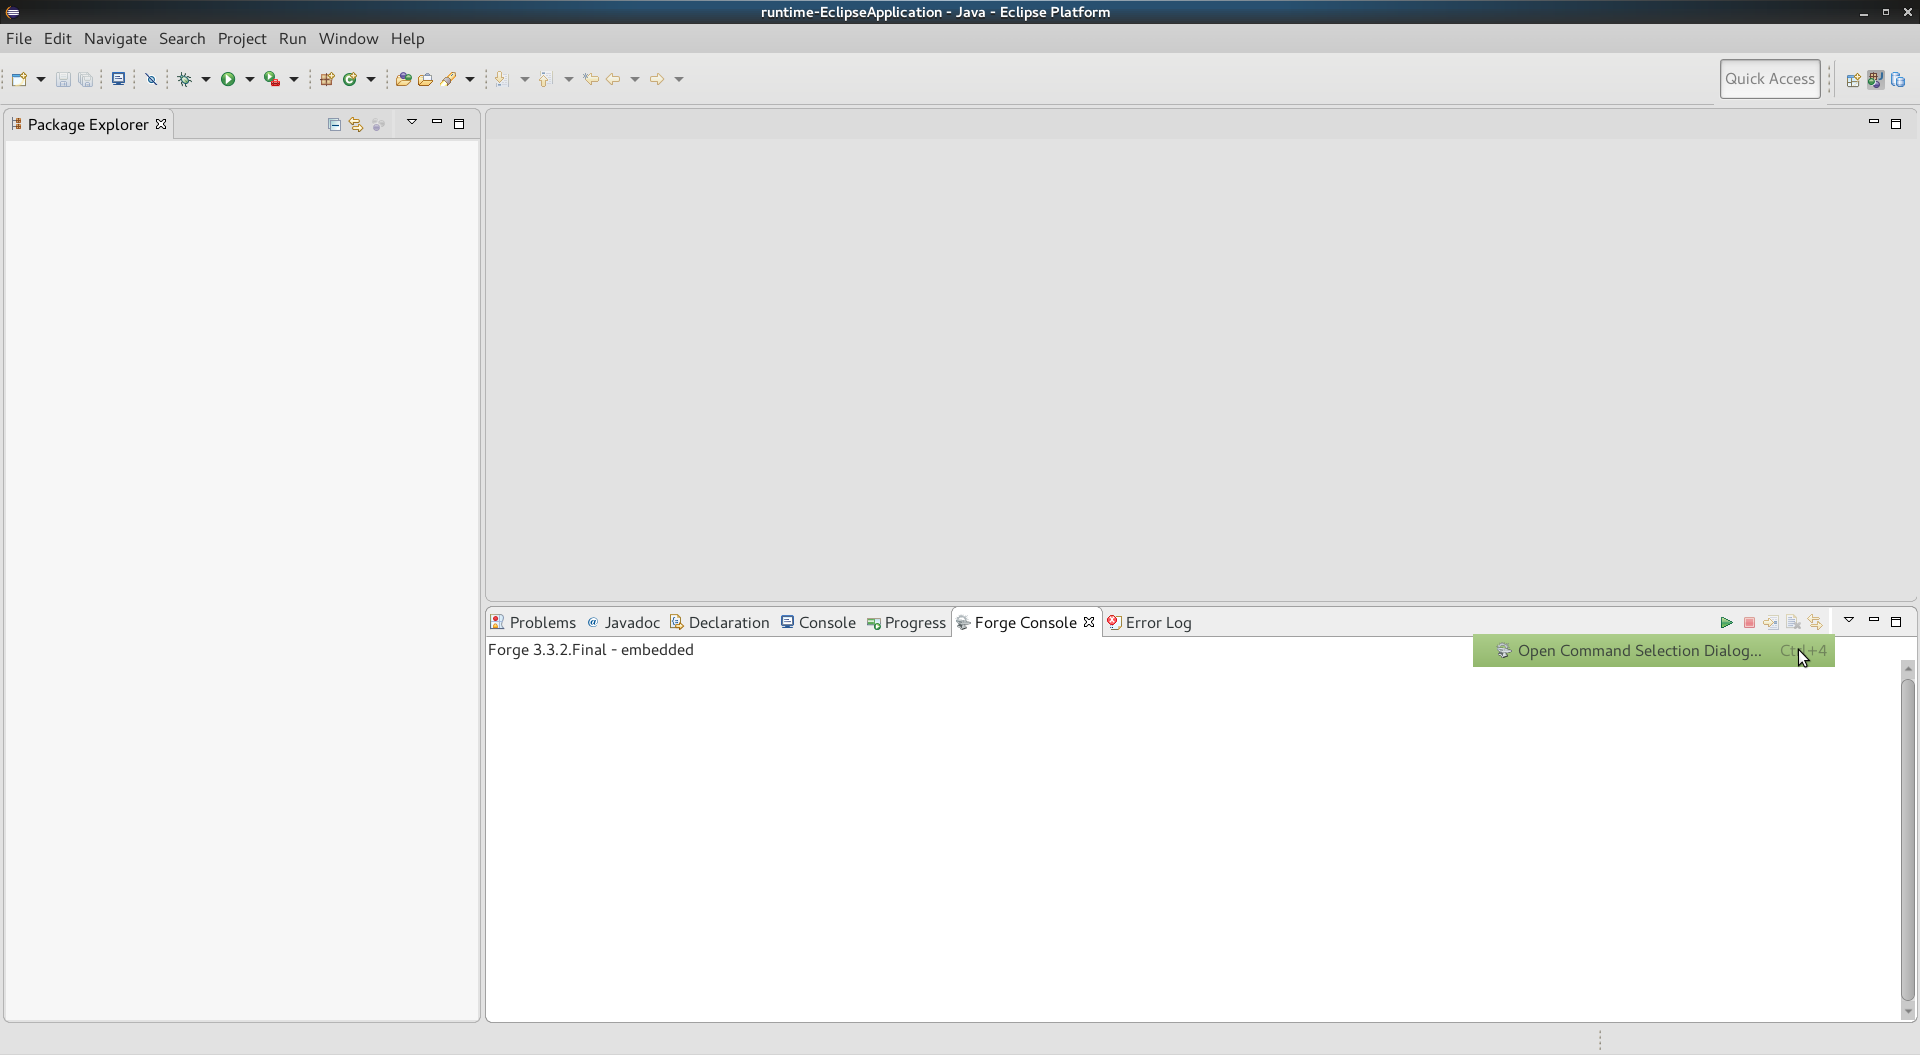
New Menu in Forge Console view to trigger the Command Selection Dialog
Now it’s possible to bring the Command Selection Dialog menu (invoked when Ctrl/Command + 4 is pressed) by choosing the "Open Command Selection Dialog…" menu item in the Forge Console view.
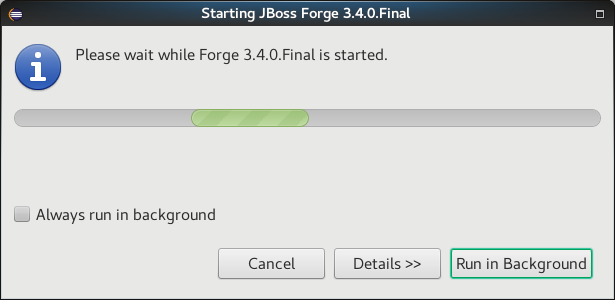
Forge Runtime updated to 3.4.0.Final
The included Forge runtime is now 3.4.0.Final. Read the official announcement here.
OpenShift
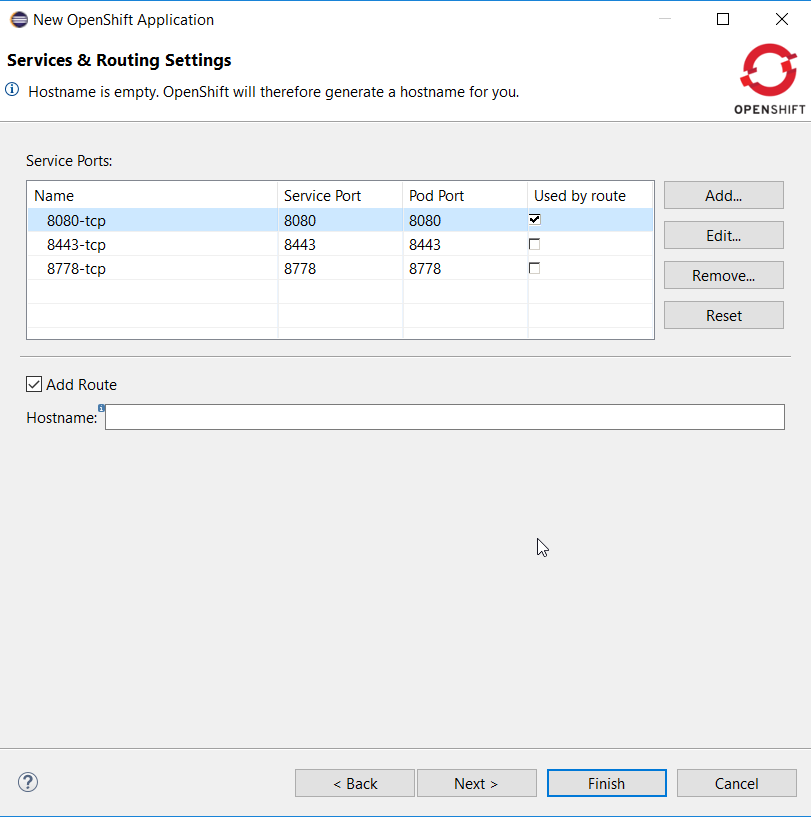
User controlled hostname when creating routes
When an application is being deployed to Openshift, a route is optionally created if required by the user. Openshift/CDK used to create an xip.io based hostname. User can now set its own hostname. This allows for both changing the DNS to local IP provider (nip.io) or using you own enterprise DNS naming strategy.
The hostname can be accessed from the Services and Routing Settings page when deploying an application:
Related JIRA: JBIDE-23147
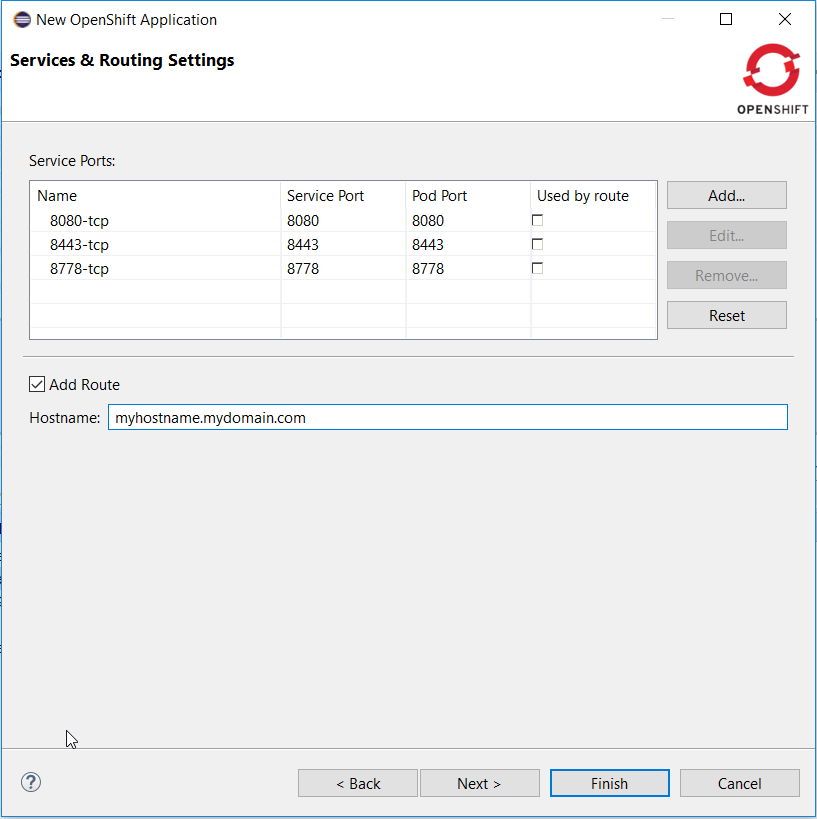
Create routes targetting a specific service port
When an application is being deployed to Openshift, a route is optionally created if required by the user. It is now possible to target a specific port (exposed by a to be created service). When the ports are being displayed, it is now possible to select one of them to be used by the route. By default, none of the ports is selected (this round robin is performed).
The route port can be accessed from the Services and Routing Settings page when deploying an application:
Related JIRA: JBIDE-23015
Node.js Debugger
Now it is possible to debug Node.js applications deployed to Openshift. All you need to do is creating a Server Adapter for the app and running it in the Debug mode. After that a new V8 debug session will be created:
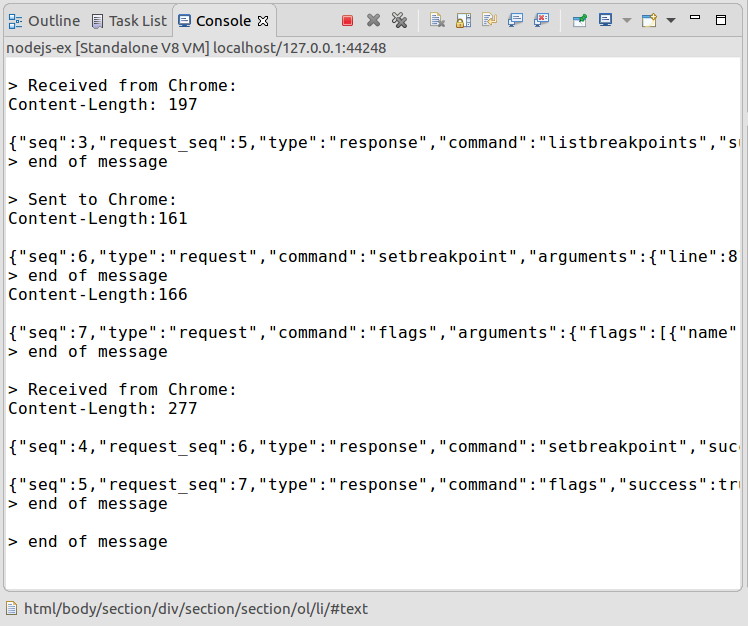
Put some breakpoints in the code and start debugging!
Steps by steps instructions
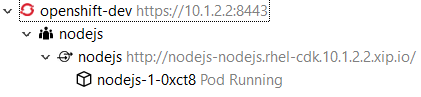
Step 1: deploy the nodejs:latest builder
Using the Openshift explorer, deploy a new application using the nodejs:latest builder image. Once deployed, your Openshift explorer should look like this:
Don’t forget to import the application source code into your workspace so that you can set breakpoints.
Step 2: create the server adapter
Select the nodejs service, right click and select the Server adapter menu item. An Openshift Server Adapter Settings dialog will be displayed, click the
Finish button. The server adater will be created and the Servers view should look like this:

Step 3: restart the server adapter in debug mode
In order to debug Javascript code, the server adapter must be restarted in debug mode. Select the server adapter, right click and select the Restart in Debug menu item.
The Servers view should look like this:

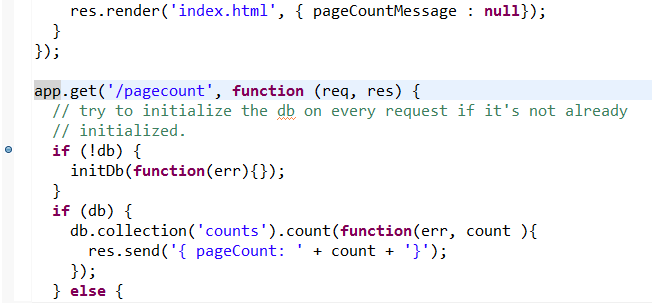
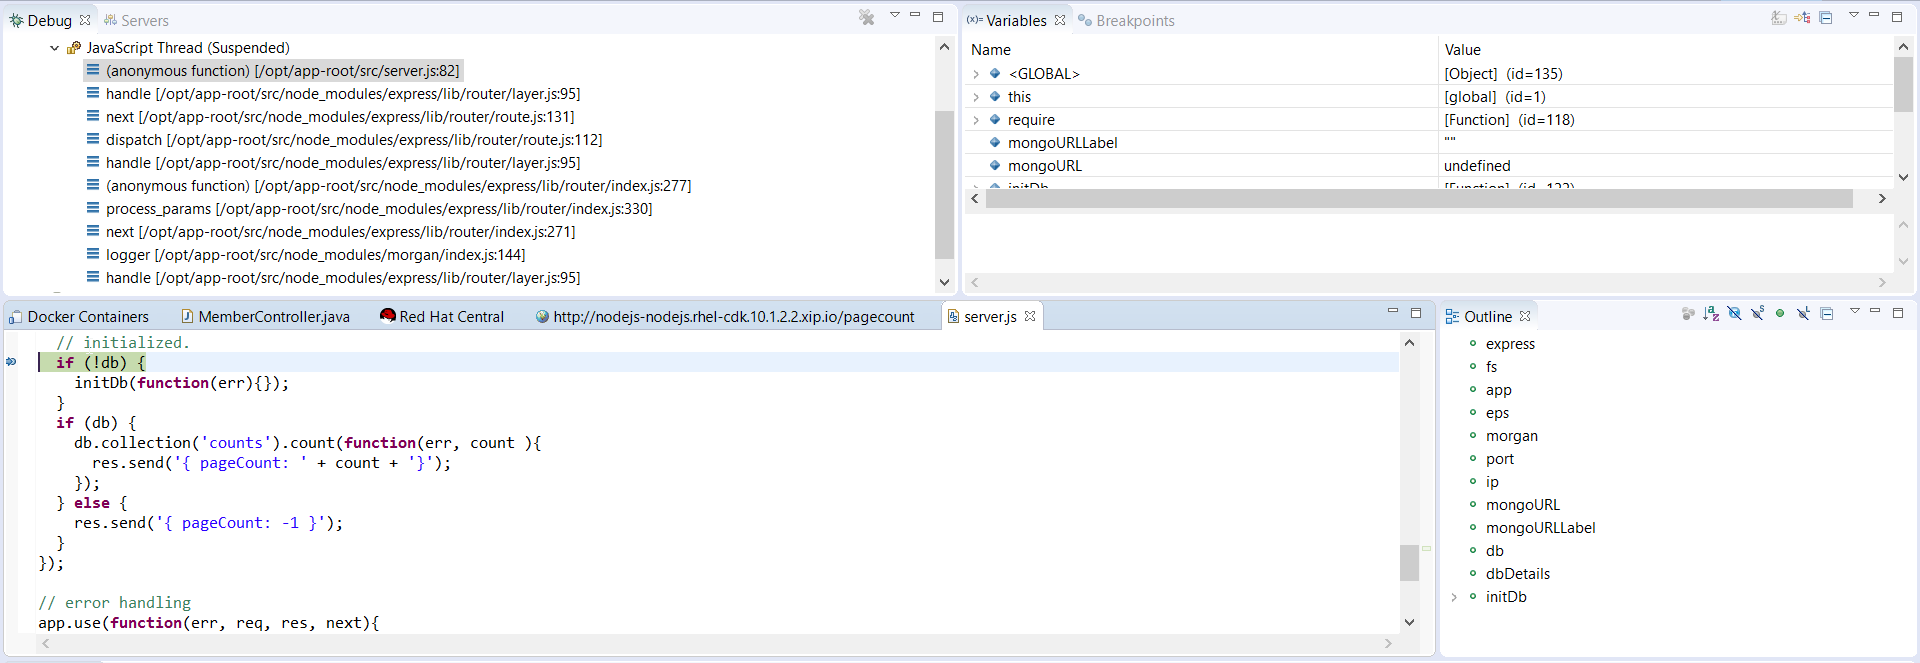
Step 4: Add a breakpoint into the server code
Open the server.js file located into the nodejs-ex project that you imported in Step 1. Around line 79, the handler for the pagecount is defined so you can add
a breakpoint in the following lines (line 82 for the first instruction).
Step 5: Open the web browser
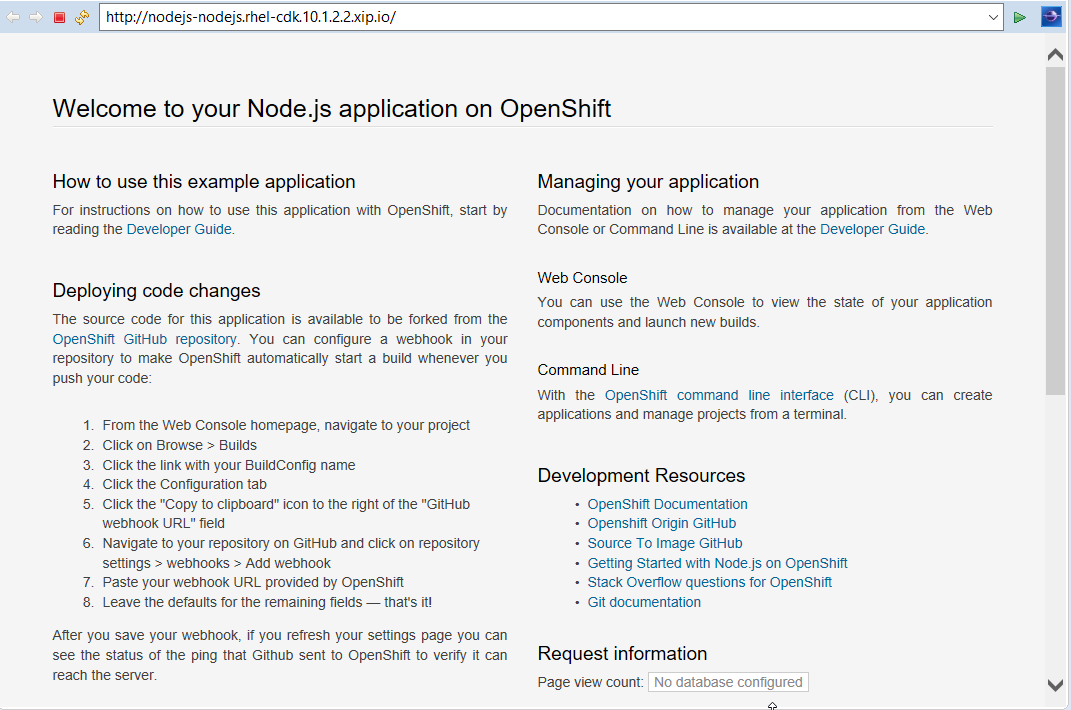
In the Openshift explorer, select the nodejs service, and select the Show in → Web Browser menu item. The home page for the application will be displayed:
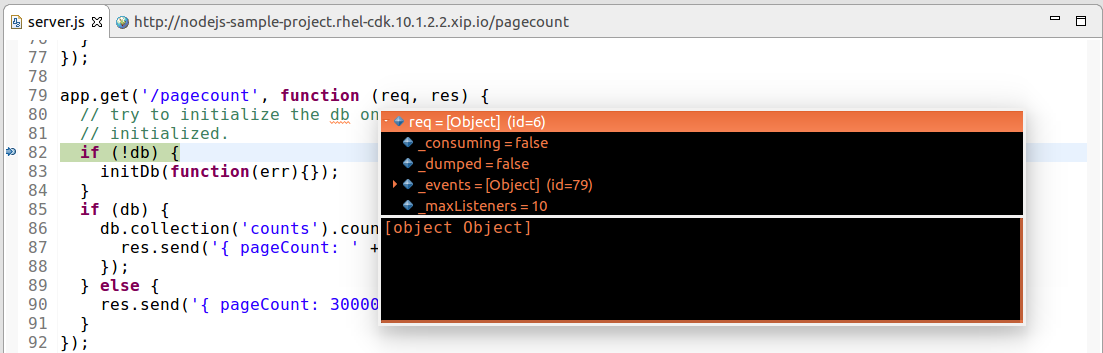
Step 6: Debug your Javascript code
Add pagecount at the end of the URL in the location toolbar and press ENTER. This will trigger Javascript debugging as you setup a breakpoint in Step 4. Depending on your Eclipse settings, you may see a dialog asking to switch to the debug perspective:
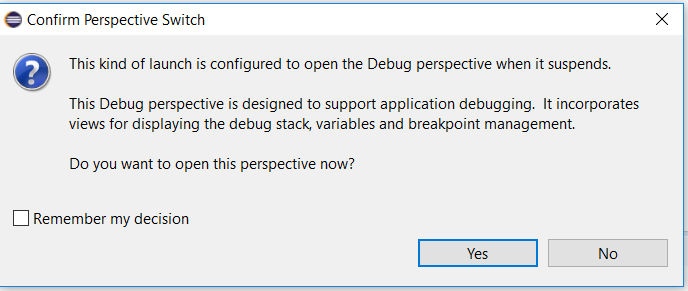
If you see this dialog, then press ENTER and the debug perspective will be shown. If you don’t see this dialog, then the debug perspective is directly shown.
Changing the code during the debug session is also supported - just save the file and new changes will be applied automatically. Here is a short demo video which describes the debugging process in action:
Related JIRA: JBIDE-22225
Common namespace is now configurable
When looking for Openshift resources (builder images, templates), a common namespace is browsed.
Earlier hardcoded openshift namespace is now configurable with default value openshift.
It can be accessed and modified through the connection extended properties:
Related JIRA: JBIDE-23014
CDK server using native terminal for better user interactions
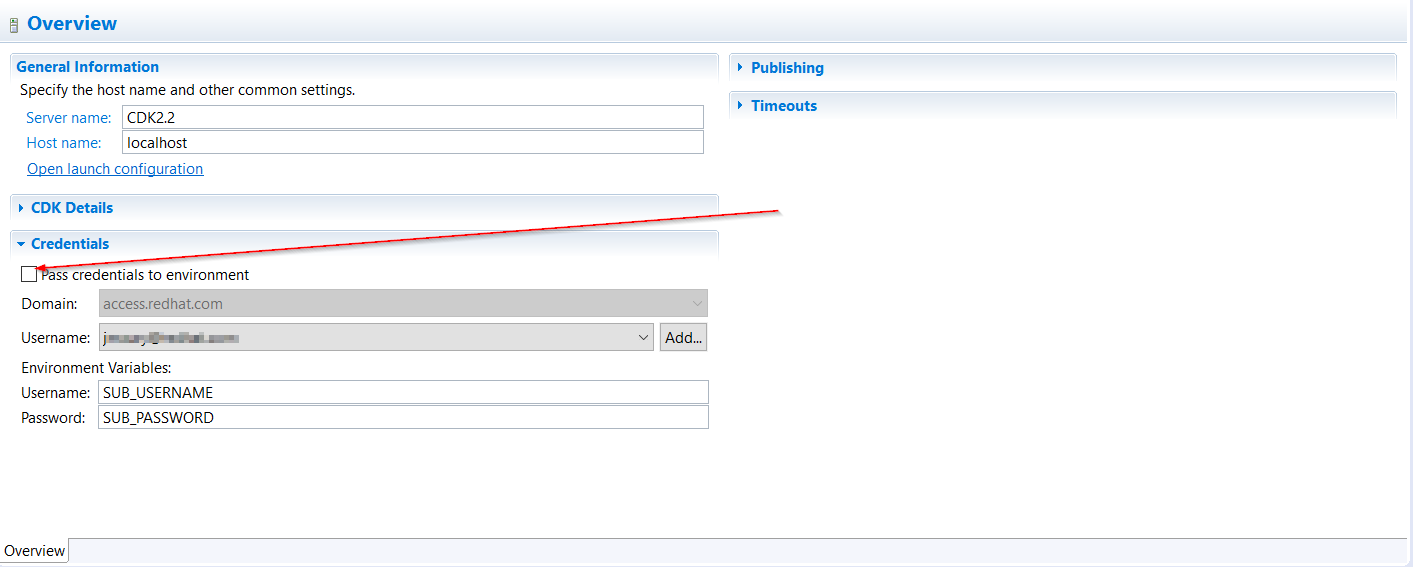
The CDK server adapter now uses a native terminal that allows better interaction with the user. In the case credentials are not passed in the Vagrant environment, the user will be asked just as with the standard Vagrant CLI and in case of registration failures, retries will be performed.
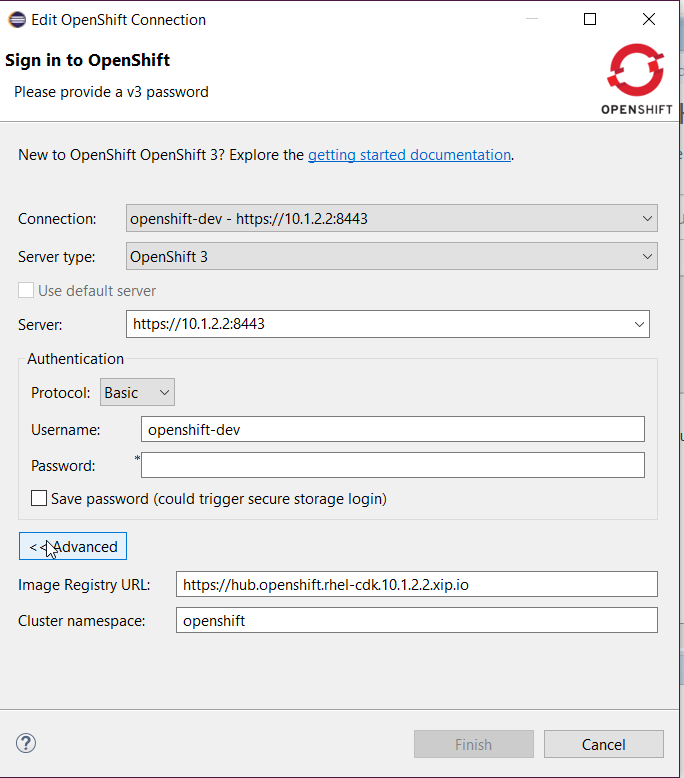
First, make sure your CDK server adapter is configured not to pass credentials:
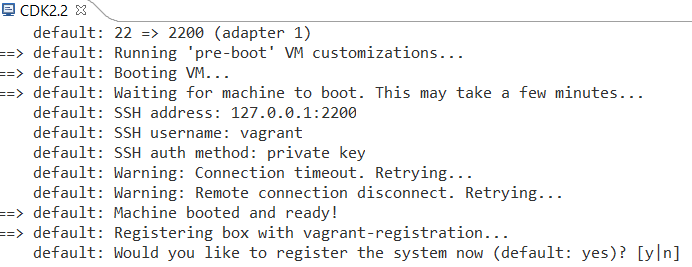
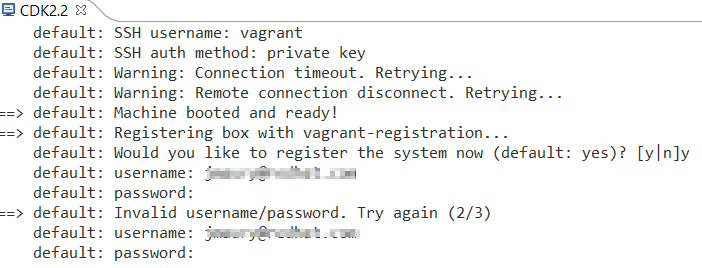
Then, start the CDK server adapter and a new terminal window will open, asking for registration:
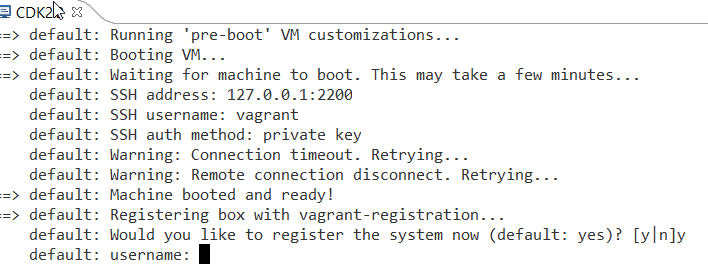
If you answered y to the previous questions, then the terminal window will ask for username:
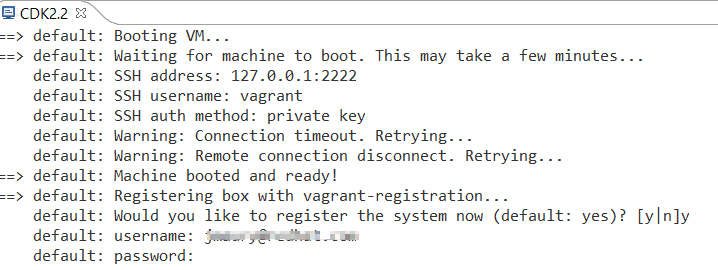
Then the terminal window will ask for password:
If the registration fails, then the terminal window will perform retries and ask again for username and password:
Related JIRA: JBIDE-23039
Server Tools
Support for Jolokia JMX Connections
For some users, accessing a remote test server via standard JMX may require opening ports that, for one reason or another, cannot be opened. In these cases, a user may choose to deploy a jolokia agent to their server. Jolokia is a deployable war archive that exposes JMX over http, typically using JSON. This feature is handy as an added tool for debugging a development application, but is not really suitable or safe to expose on production. With that in mind, the workflow is as follows:
1) Download the Jolokia war file from jolokia.org, and place it in the proper deployments folder for your application server. For wildfly, this folder is 'standalone/deployments'
2) Start your server via whatever method you typically use. If your usecase allows it, use the Servers view to create and start a server adapter. If this workflow doesn’t work for you, you may wish to start the server manually.
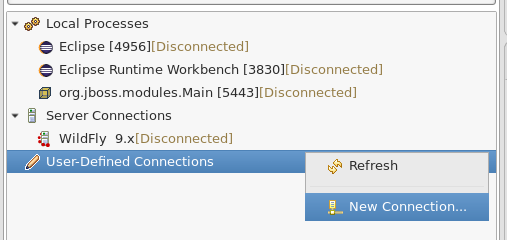
3) Once your server is started, open the JMX Navigator
4) Right click on the "User-Defined Connections" item, and select 'New Connection'
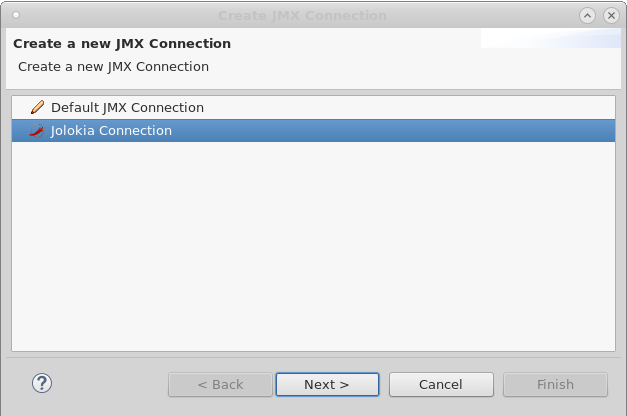
5) Select 'Jolokia Connection'
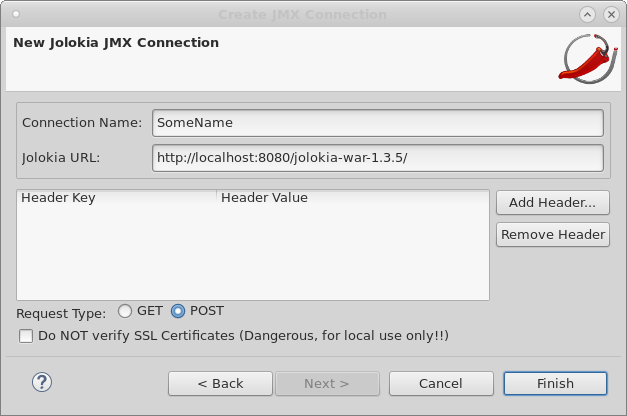
6) Give the connection a name, and the url at which jolokia can be reached. Then finish the wizard
7) Now you can browse your JMX tree in the JMX Navigator!
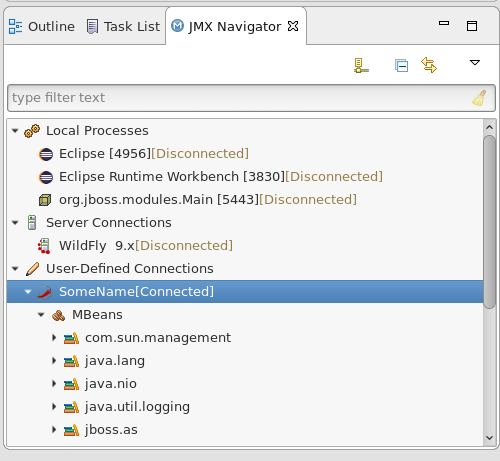
Most other JMX operations will work. You can double-click an MBean node to open the editor, check properties, or invoke operations. Notifications, however, are not supported.
Related JIRA: JBIDE-23429 - Jolokia JMX Connection