What's New in 4.4.2.AM3
Forge Tools
Forge Runtime updated to 3.3.3.Final
The included Forge runtime is now 3.3.3.Final. Read the official announcement here.
OpenShift
Node.js Debugger
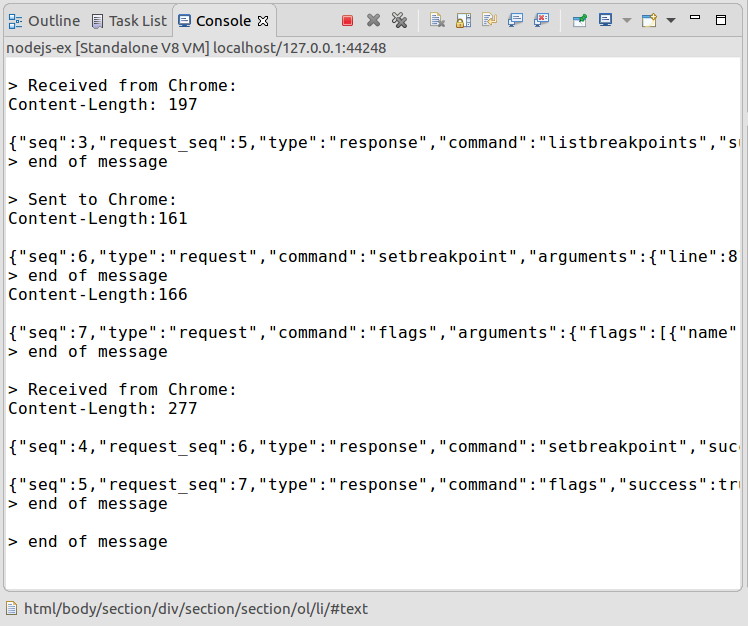
Now it is possible to debug Node.js applications deployed to Openshift. All you need to do is creating a Server Adapter for the app and running it in the Debug mode. After that a new V8 debug session will be created:
Put some breakpoints in the code and start debugging!
Steps by steps instructions
Step 1: deploy the nodejs:latest builder
Using the Openshift explorer, deploy a new application using the nodejs:latest builder image. Once deployed, your Openshift explorer should look like this:
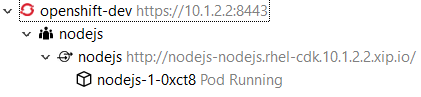
Don’t forget to import the application source code into your workspace so that you can set breakpoints.
Step 2: create the server adapter
Select the nodejs service, right click and select the Server adapter menu item. An Openshift Server Adapter Settings dialog will be displayed, click the
Finish button. The server adater will be created and the Servers view should look like this:

Step 3: restart the server adapter in debug mode
In order to debug Javascript code, the server adapter must be restarted in debug mode. Select the server adapter, right click and select the Restart in Debug menu item.
The Servers view should look like this:

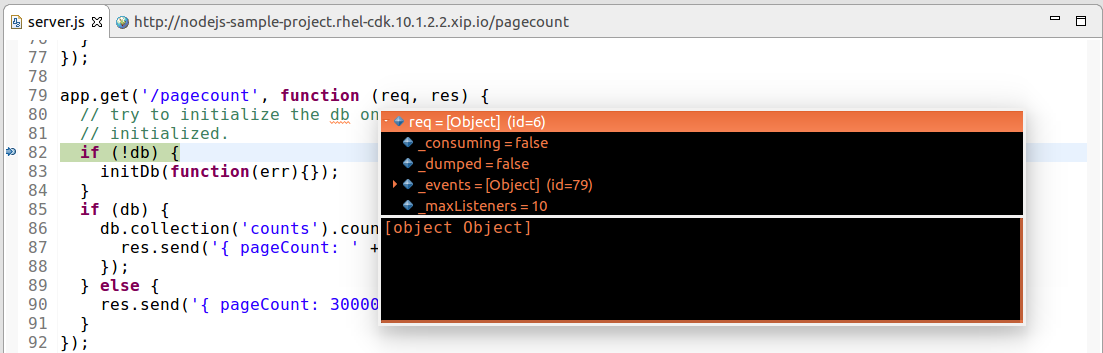
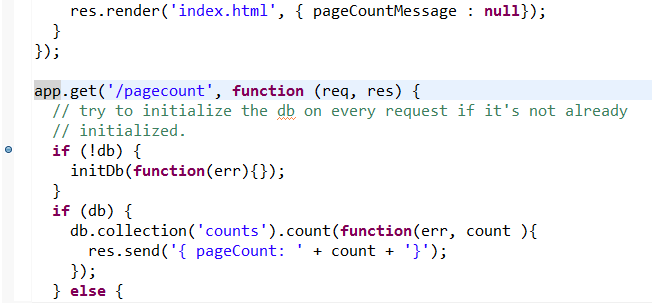
Step 4: Add a breakpoint into the server code
Open the server.js file located into the nodejs-ex project that you imported in Step 1. Around line 79, the handler for the pagecount is defined so you can add
a breakpoint in the following lines (line 82 for the first instruction).
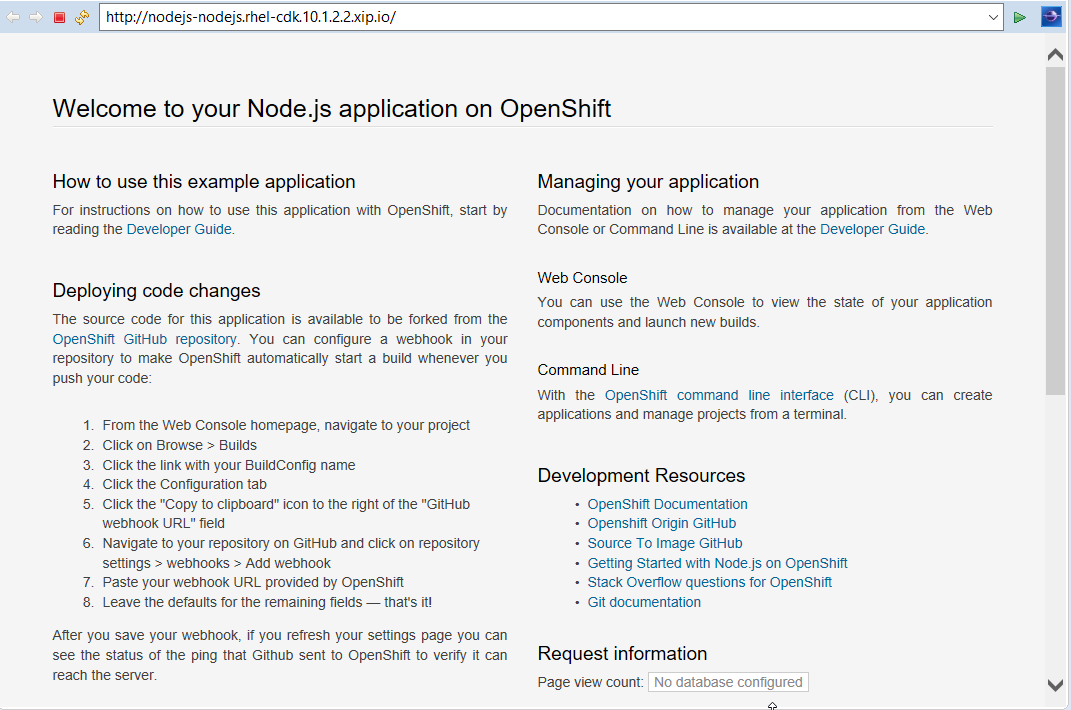
Step 5: Open the web browser
In the Openshift explorer, select the nodejs service, and select the Show in → Web Browser menu item. The home page for the application will be displayed:
Step 6: Debug your Javascript code
Add pagecount at the end of the URL in the location toolbar and press ENTER. This will trigger Javascript debugging as you setup a breakpoint in Step 4. Depending on your Eclipse settings, you may see a dialog asking to switch to the debug perspective:
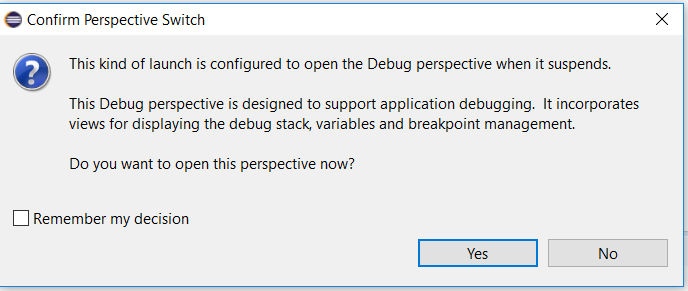
If you see this dialog, then press ENTER and the debug perspective will be shown. If you don’t see this dialog, then the debug perspective is directly shown.
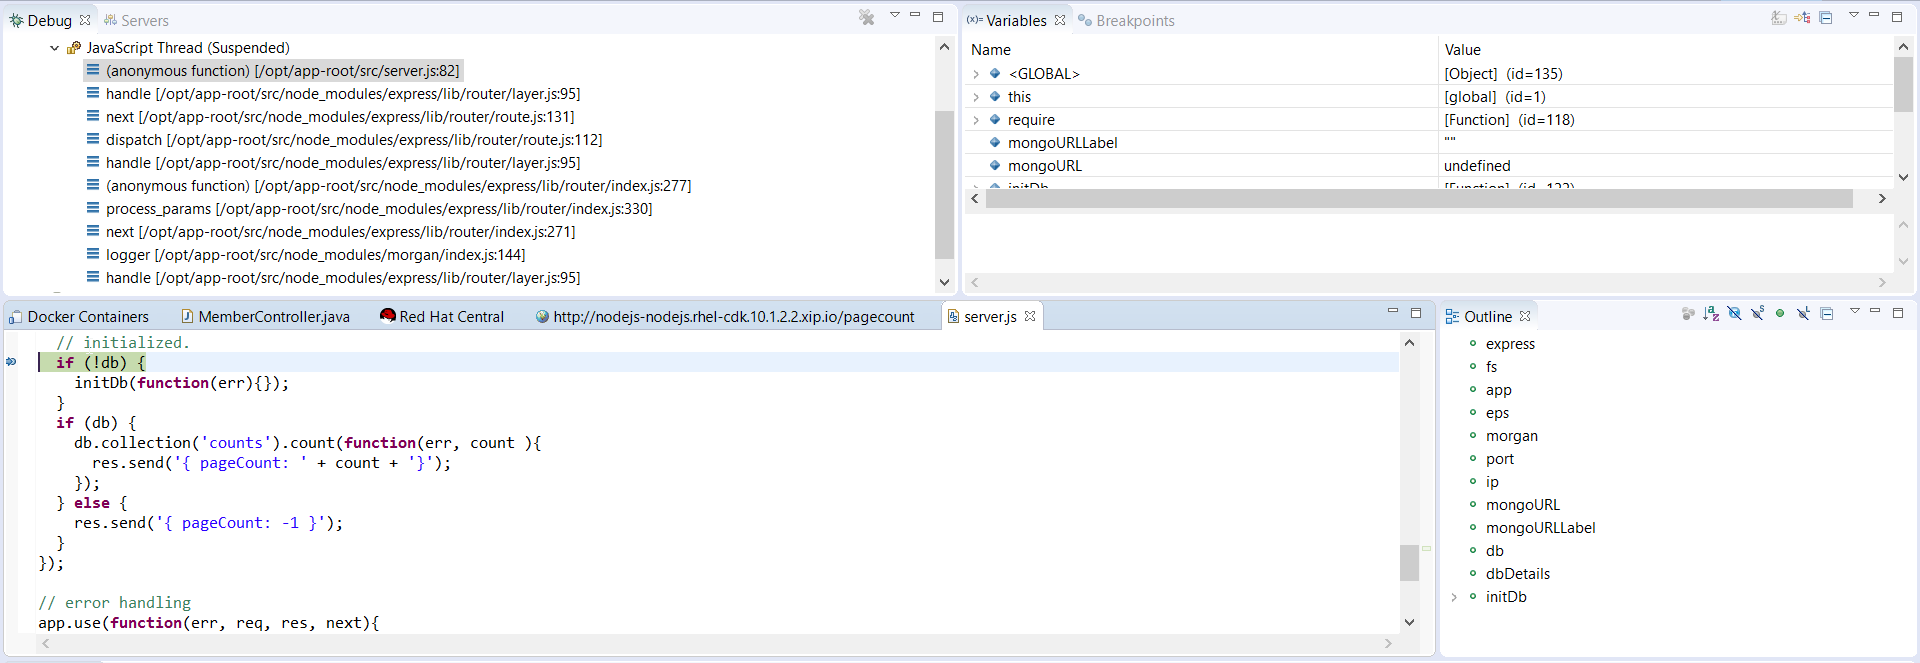
Changing the code during the debug session is also supported - just save the file and new changes will be applied automatically. Here is a short demo video which describes the debugging process in action:
Related JIRA: JBIDE-22225