
JBoss Tools 4.15.0 and Red Hat CodeReady Studio 12.15 for Eclipse 2020-03 are here waiting for you. Check it out!
Installation
Red Hat CodeReady Studio comes with everything pre-bundled in its installer. Simply download it from our Red Hat CodeReady product page and run it like this:
java -jar codereadystudio-<installername>.jar
JBoss Tools or Bring-Your-Own-Eclipse (BYOE) CodeReady Studio require a bit more:
This release requires at least Eclipse 4.15 (2020-03) but we recommend using the latest Eclipse 4.15 2020-03 JEE Bundle since then you get most of the dependencies preinstalled.
Once you have installed Eclipse, you can either find us on the Eclipse Marketplace under "JBoss Tools" or "Red Hat CodeReady Studio".
For JBoss Tools, you can also use our update site directly.
http://download.jboss.org/jbosstools/photon/stable/updates/
What is new?
Our main focus for this release was a new tooling for the Quarkus framework, improvements for container based development and bug fixing. Eclipse 2020-03 itself has a lot of new cool stuff but let me highlight just a few updates in both Eclipse 2020-03 and JBoss Tools plugins that I think are worth mentioning.
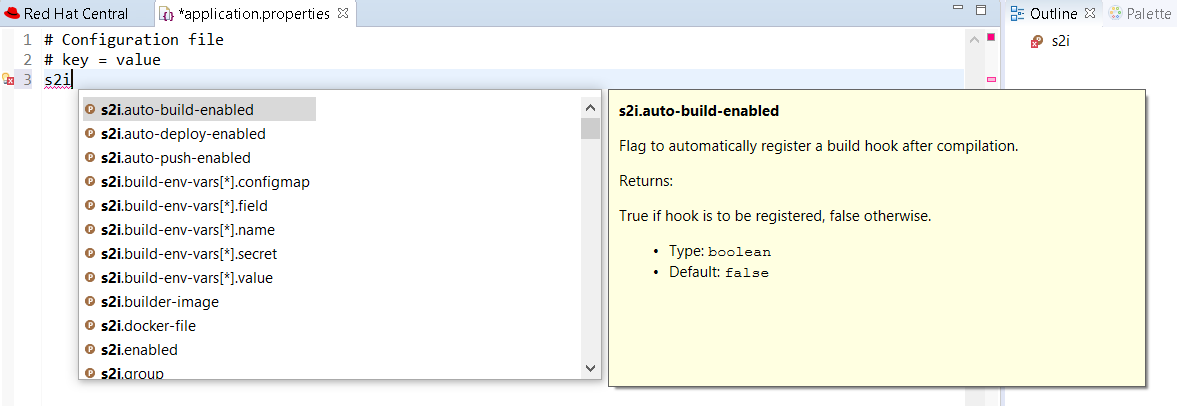
Language support for MicroProfile REST Client properties
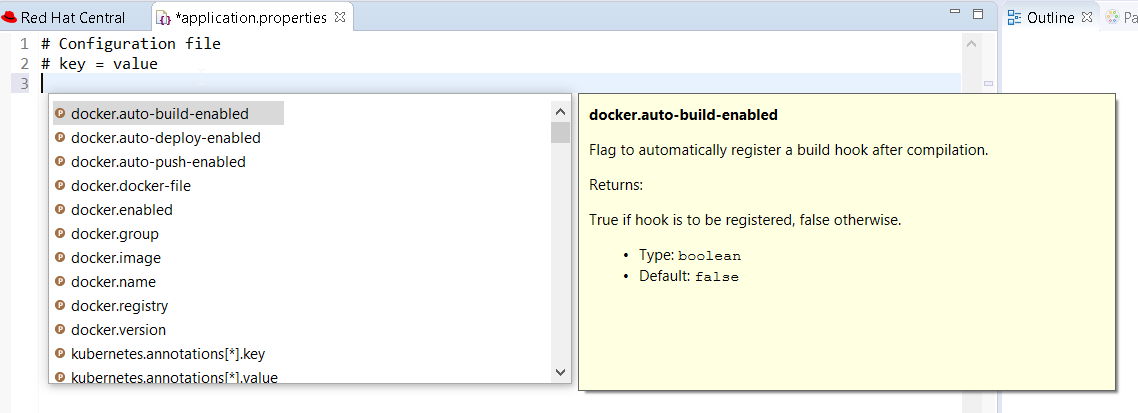
Likewise, there is now completion, hover, documentation and validation for the MicroProfile properties from REST Client.
After registering a REST client using @RegisterRestClient like so:
package org.acme;

import javax.ws.rs.GET;
import javax.ws.rs.Path;
import javax.ws.rs.core.Response;

import org.eclipse.microprofile.rest.client.inject.RegisterRestClient;

@RegisterRestClient
public interface MyServiceClient {
	@GET
    @Path("/greet")
    Response greet();
}
The related MicroProfile Rest config properties will have language feature support (completion, hover, validation, etc.).
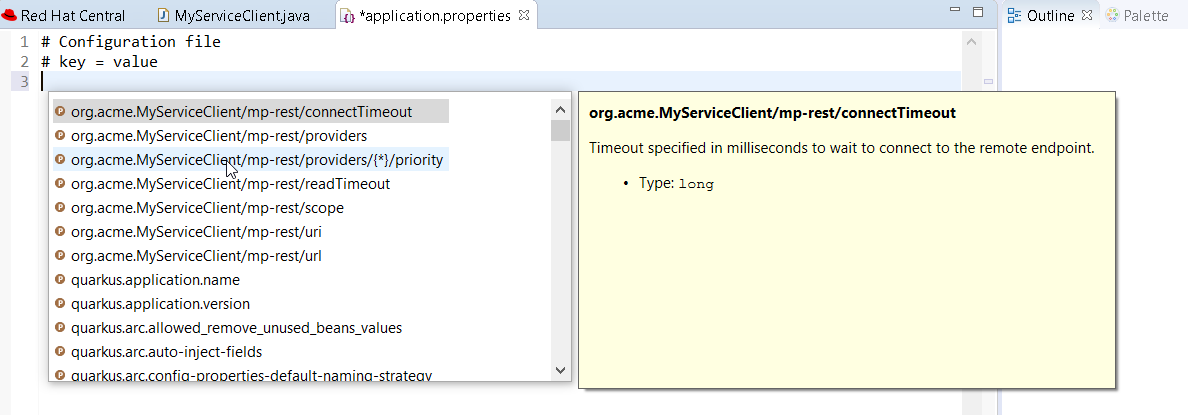
Change the Java code so that the configuration key is changed:
package org.acme;
import javax.ws.rs.GET;
import javax.ws.rs.Path;
import javax.ws.rs.core.Response;
import org.eclipse.microprofile.rest.client.inject.RegisterRestClient;
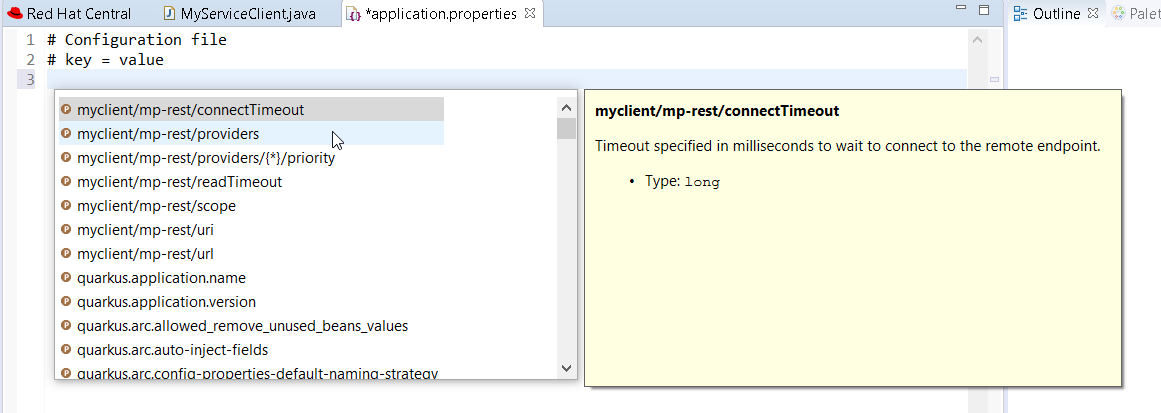
@RegisterRestClient(configKey = "myclient")
public interface MyServiceClient {
@GET
@Path("/greet")
Response greet();
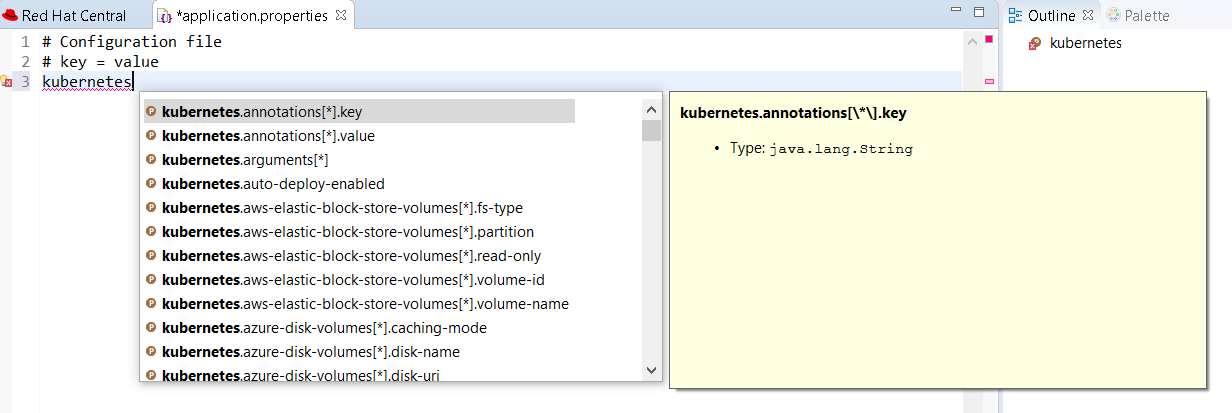
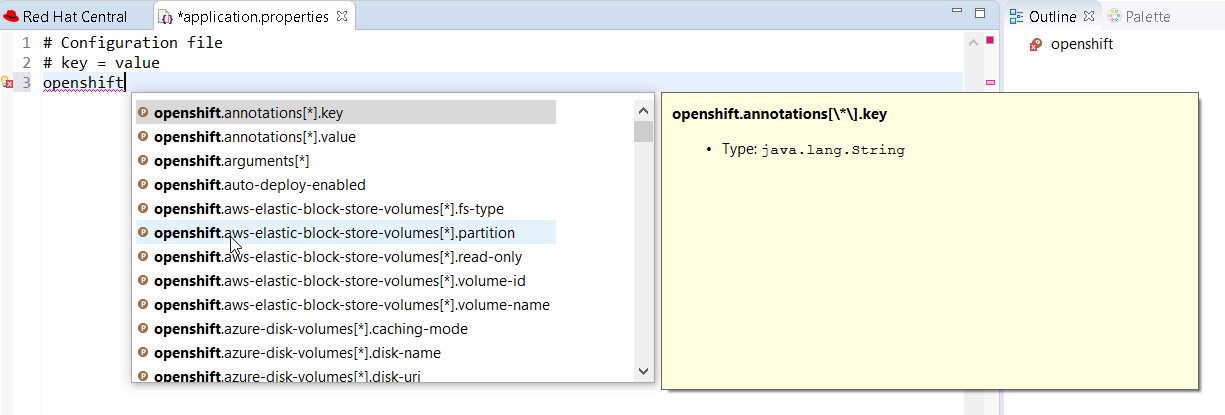
}and notice the code assist is changed accordingly:
Language support for MicroProfile Health
Likewise, there is now completion, hover, documentation and validation for the MicroProfile Health artifacts.
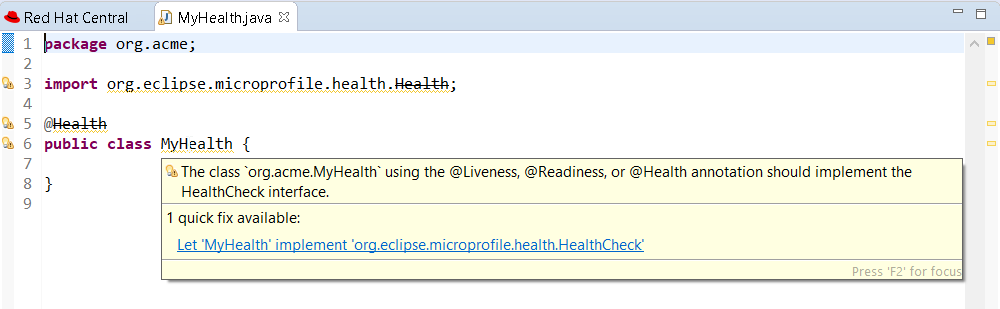
So if you have the following Health class:
package org.acme;

import org.eclipse.microprofile.health.Health;

@Health
public class MyHealth {

}
you will get a validation error (as the class does not implement the HealthCheck
interface:
Similarly, if you have a class that implements HealthCheck but is not annotated with Health, some workflow applies:
package org.acme;

import org.eclipse.microprofile.health.HealthCheck;
import org.eclipse.microprofile.health.HealthCheckResponse;

public class MyHealth implements HealthCheck {

	@Override
	public HealthCheckResponse call() {
		// TODO Auto-generated method stub
		return null;
	}

}
you will get a validation message (as the class is not annotated with Health
interface):
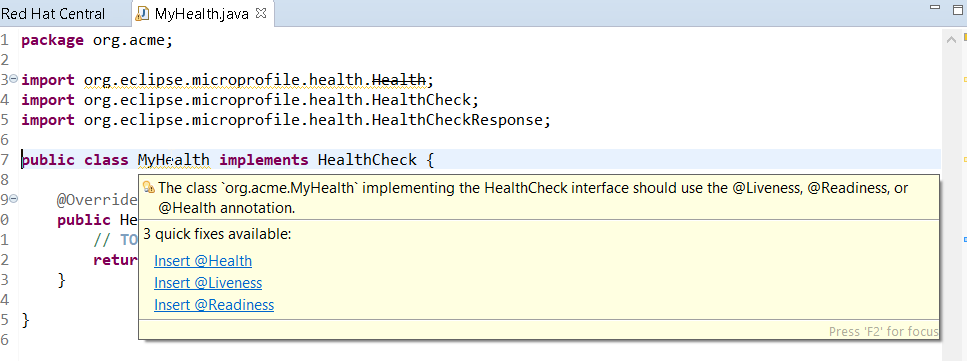
As there are several ways to fix the problem, then several quick fixes are proposed.
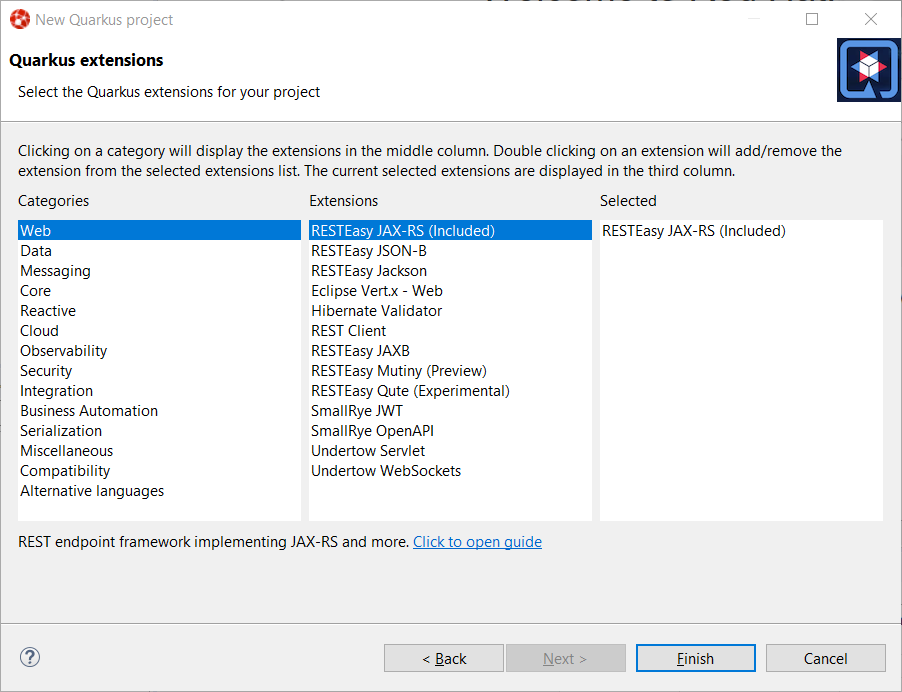
Better extensions reporting in the Quarkus project wizard
With the Quarkus extensions ecosystem growing, we improved information about extensions in the Quarkus project wizard.
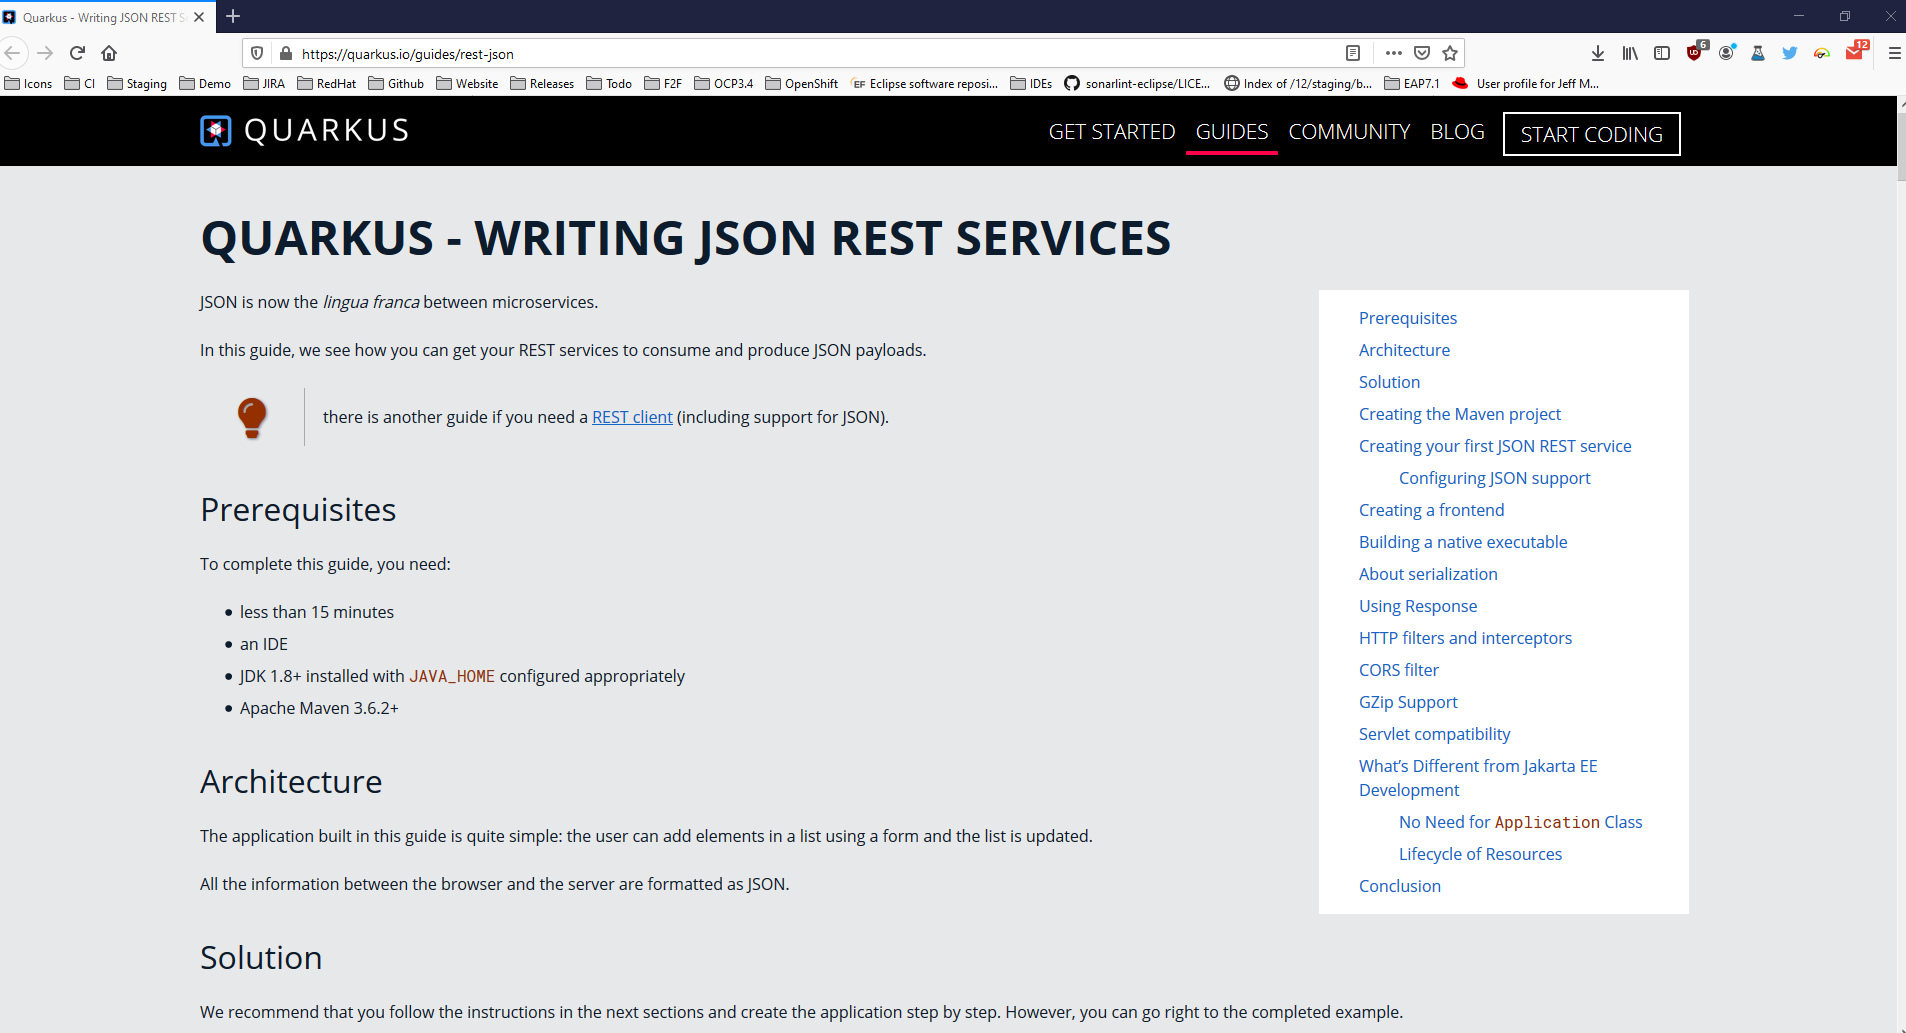
When you select an extension in the wizard, you will see the extension description in the lower side of the wizard. If the extension has a guide on the Quarkus web site, a link will also be displayed and clicking on that link will open the guide on your local web browser.
Hibernate Tools
Platform
Debug
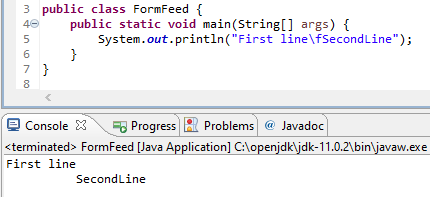
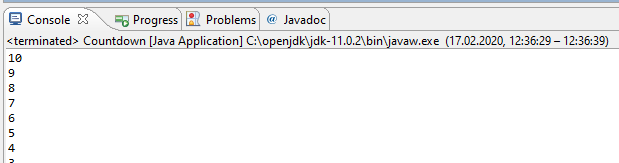
Console View now interprets form feed and vertical tab characters
The interpretation of ASCII control characters in the Console View was extended to
recognize the characters: \f - form feed and \v - vertical tab (in languages that support it).
This feature is disabled by default. You can enable it on the Run/Debug > Console preference page.
Preferences
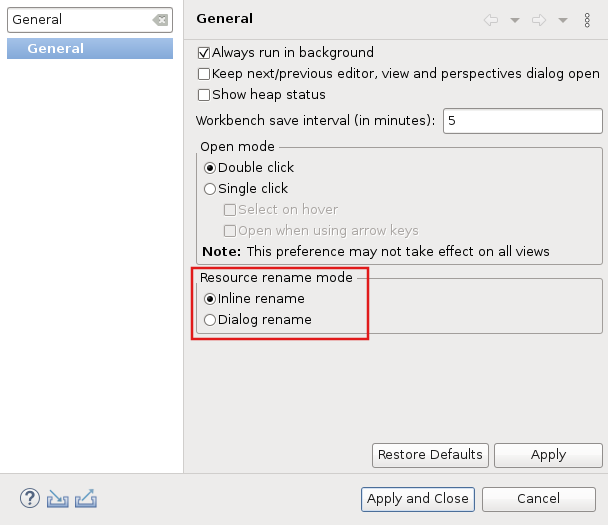
Preference to select resource rename mode
A preference has been added in the General preferences page, that allows you to select the resource renaming mode in the Project Explorer: either open an inlined text field or a dialog. By default, the inline rename mode is selected.
The preference can also be specified via product customization:
-
org.eclipse.ui.workbench/RESOURCE_RENAME_MODE=inline
-
org.eclipse.ui.workbench/RESOURCE_RENAME_MODE=dialog
| Rename that would affect more than 1 resource is always performed with a dialog. |
General Updates
Redraw is turned off by default during collapse and expand operations in tree viewer
To improve interactive performance, redraw is turned off by default during the collapse and expand operation of tree viewers. This significantly improves these operations compared to drawing the updates synchronously.
Java Developement Tools (JDT)
Java 14 Support
Java 14
Java™ 14 is available and Eclipse JDT supports Java 14 for the Eclipse 4.15 release.
The release notably includes the following Java 14 features:
-
JEP 361: Switch Expressions (Standard).
-
JEP 359: Records (Preview).
-
JEP 368: Text Blocks (Second Preview).
-
JEP 305: Pattern Matching for Instanceof (Preview).
Please note that preview option should be on for preview language features. For an informal introduction of the support, please refer to Java 14 Examples wiki.
Java Editor
Subword code completion
Content Assist now supports subword patterns, similar to Eclipse Code Recommenders
and other IDEs. For example, completing on addmouselistener proposes results
like addMouseMoveListener and addMouseWheelListener.
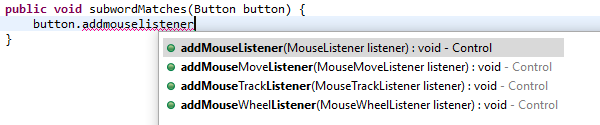
This feature can be enabled using the Show subword matches option on the Java > Editor > Content Assist preference page.
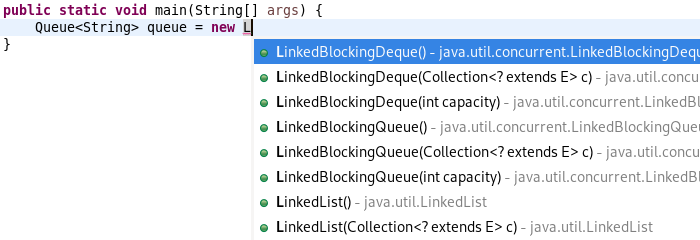
Subtype code completion
Content Assist will prioritize displaying constructor completions whose declaring type inherits from the expected return type within the completion context.
For example, completing on :
Queue<String> queue = new L
prioritizes constructors for LinkedBlockingQueue, LinkedBlockingDeQueue
and LinkedList.
Option for non-blocking Java completion
Code completion in the Java editor can now be run in a separate non-UI thread to prevent UI freezes in case of long computations. To enable this non-blocking computation, go to Preferences > Java > Editor > Content Assist > Advanced and check Do not block UI Thread while computing completion proposals preference. This option is currently disabled by default.
Non-blocking completion is useful when completion proposals are long to compute, as it allows you to type or use other parts of the IDE in the meantime.
Some completion participants may prevent this option from being effective (typically
if the Java completion extension doesn’t declare requiresUIThread="false"),
so the UI thread may still be used even if this option is set.
Quick fix to wrap Optional statements
A quick fix has been added to wrap an Optional statement.
The options for a primitive statement are: Optional.empty() and Optional.of().
Type statements also have Optional.ofNullable().
Example for type objects:
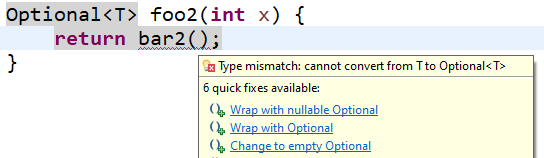
Selecting Wrap with nullable Optional for type object results in:

Example for primitive:
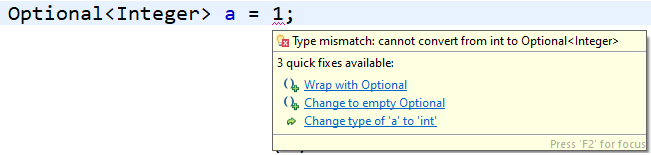
Selecting Wrap with Optional for primitive results in:

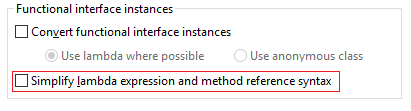
Simplify functional interface instances
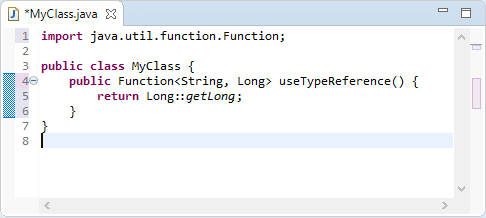
A new clean up has been added that simplifies the lambda expression and the method reference syntax and is enabled only for Java 8 and higher.
The clean up removes parenthesis for a single untyped parameter, return statement for a single expression and brackets for a single statement. It replaces a lambda expression by a creation or a method reference when possible.
To select the clean up, invoke Source > Clean Up…, use a custom profile, and on the Configure… dialog select Simplify lambda expression and method reference syntax on the Code Style tab.
For the given code:

You get this after the clean up:
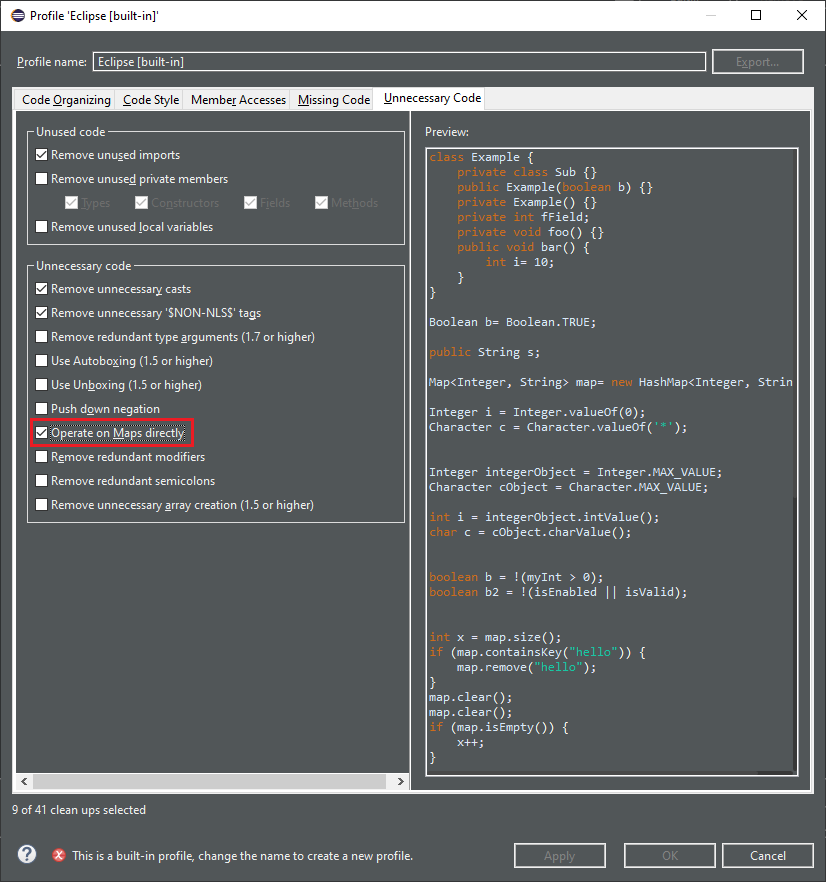
Directly use Map method
Some map manipulations are unnecessarily verbose. The new cleanup option Operate on Maps directly calls methods on a map instead of calling the same methods on the key set or the values.
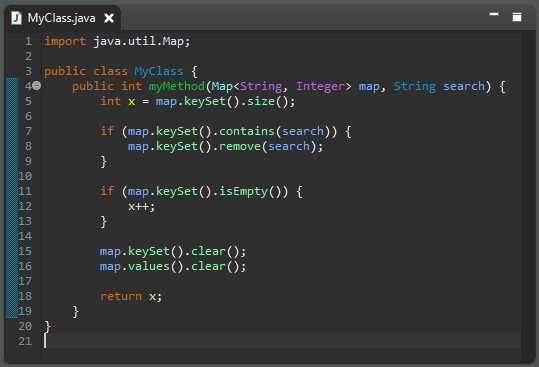
Beware! If you create Map implementations that don’t follow the Map specification,
this cleanup may break the behavior (a size() method that changes the values,
an iterator that destroys the items…).
For the given code:
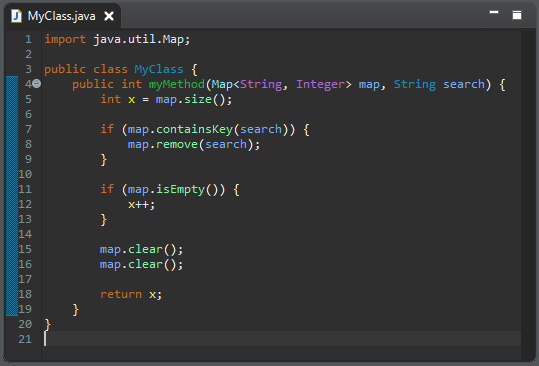
You get this after the clean up:
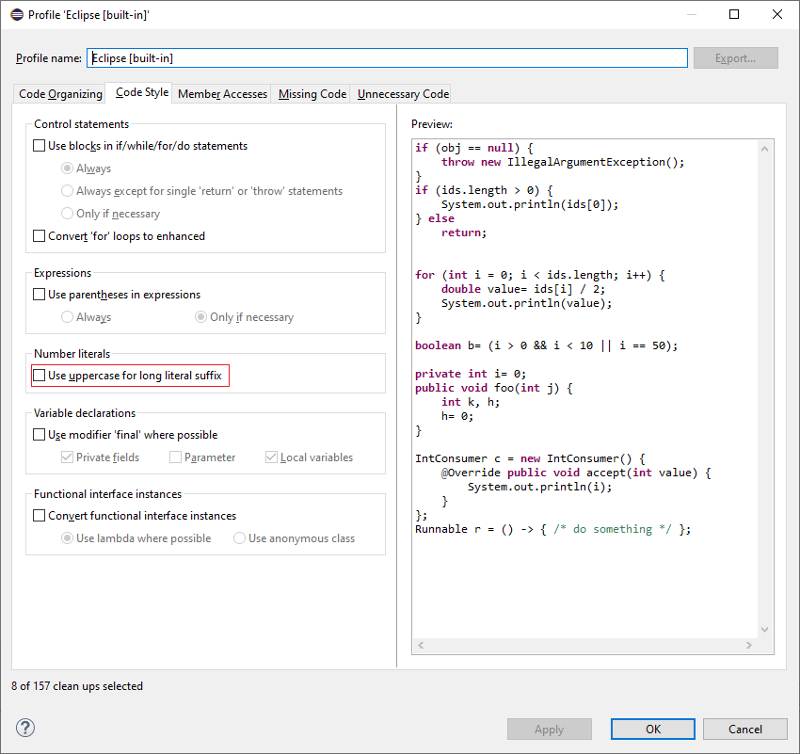
Uppercase for long literal suffix
A new cleanup option Use uppercase for long literal suffix has been added. It will rewrite
long literals like 101l with an uppercase L like 101L to avoid ambiguity.
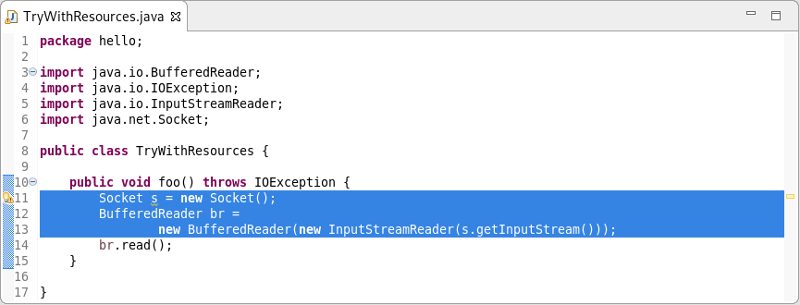
Surround with "try-with-resources" block
Corresponding to the quick fix which will surround a selection with a "try-with-resources" block, a new action has been added to the Surround With menu.
For example, selecting the lines as shown:
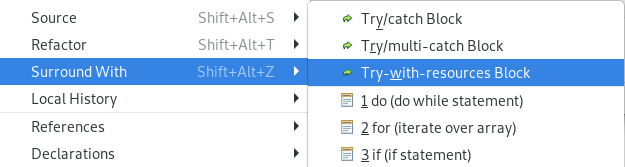
and right-clicking and selecting Surround With → Try-with-resources Block
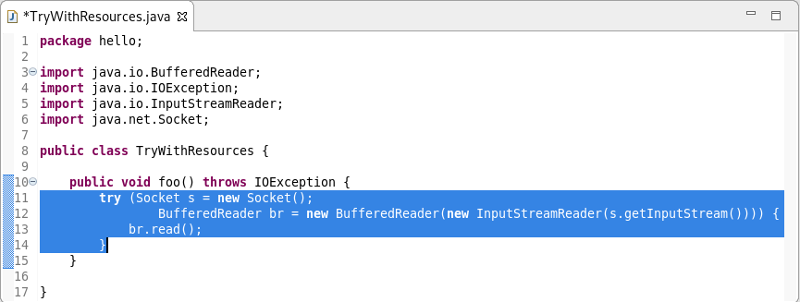
results in:

Java Compiler
Warn when legacy code can taint null-checked values
When using null-annotations for advanced null analysis, it is inherently tricky to combine your code with "legacy" code that has no null annotations and has not been blessed by such analysis.
Previously, Eclipse would only warn you when you obtain a dubious value from a legacy API, but it would keep silent in the opposite case: passing a value of an annotated type into legacy API. Still in specific situations this can cause a NullPointerException to be thrown in your null-checked code:
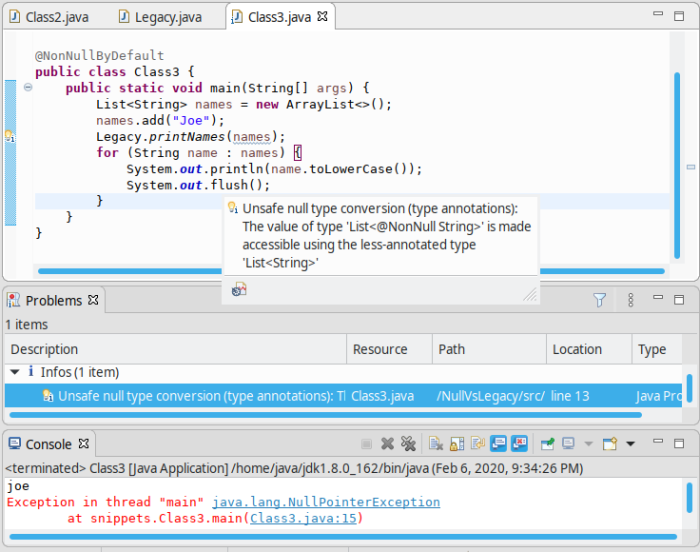
The console shows an exception thrown from within your checked main method (see
the class-level @NonNullByDefault). It also shows the new warning, which Eclipse
raises to alert you of this danger.
Hint: The shown code assumes the list names to have type List<@NonNull String>,
but the legacy method Legacy.printNames() succeeds to taint this list by inserting
a null element. This goes unnoticed because that method views the list has having type
List<String>, with no nullness constraint on the type argument.
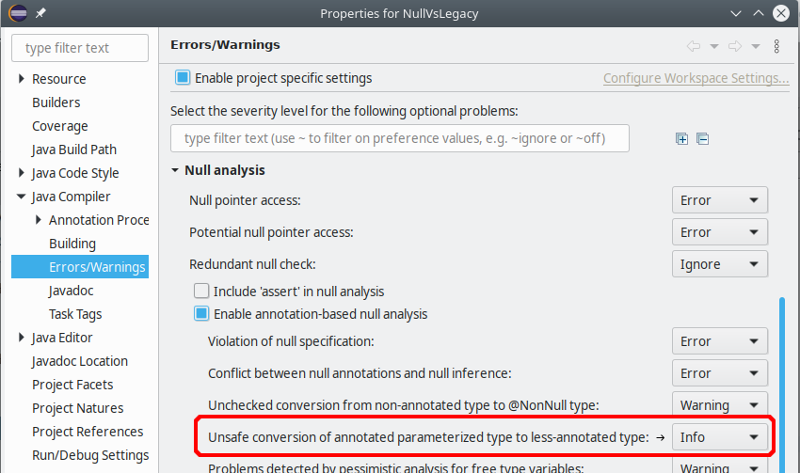
By default this problem is raised at level info, but the severity can be configured in the compiler settings:
Improved Resource leak analysis
Resource leak analysis has been improved in several ways.
Most importantly, the analysis now consistently considers resources (=values of type
AutoCloseable) which are acquired using a method call, where previously under
some circumstances resource allocation got unnoticed if it was wrapped in a factory
method, like in the following example:
makePrintWriter("/tmp/log.txt").printf("%d", 42);
// a PrintWriter is never closed!
Second, resource leak analysis now leverages knowledge about well-known resource classes
that support fluent programming, i.e., instance methods which return this to enable
chains of method calls. Where a naive analysis could consider the method result
as a new resource coming into scope, special knowledge about these classes informs
the analysis that it is one and the same resource. This concerns the following
system classes:
- from java.io
-
CharArrayWriter, Console, PrintStream, PrintWriter, StringWriter, Writer
- from java.nio.channels
-
AsynchronousFileChannel, AsynchronousServerSocketChannel, FileChannel, NetworkChannel, SeekableByteChannel, SelectableChannel, Selector, ServerSocketChannel
- from java.util
-
Formatter
The following example is now understood to be safe, because analysis understands
that the resource returned by append() is the same as the initial pw:
PrintWriter pw = new PrintWriter("/tmp/log.txt");
pw.printf("%d", 42).append(" is the answer").close();
Generally, resource leak analysis was made more precise regarding several specific situations.
Java Formatter
Java formatter application requires a workspace
The Java formatter application will provide a sensible error message if a workspace is
required but not provided (-data command line option). This also enables the -help
option to be run on the formatter without a workspace specified.
A new bundle services the org.eclipse.jdt.core.JavaCodeFormatter application.
This new bundle is part of the JDT feature. Users who are not using the JDT feature to
define their set of bundles will need to add
org.eclipse.jdt.core.formatterapp to their set of bundles.
And more…
You can find more noteworthy updates in on this page.

