We’ve been working hard on improving our tooling story for Fuse for a few months. One of the areas we’ve been focusing on specifically has been Transformation tooling. It’s been missing in the JBoss Tools suite for a while now and something we needed to address.
As a result, we ended up with the Fuse Transformation tooling, which I’ll be talking about over the course of a few blog posts.
First, What Exactly Is the Fuse Transformation Tooling?
The last transformation tooling we had in JBoss Tools leveraged Smooks to convert one format to another. This time we’re using the Dozer framework, which offers a great base for handling Java to Java transformations. Through various APIs, you can convert just about anything to a Java model these days and that gives us a good place to start.
With the addition of Fuse technologies (and some awesome developers), we gained some cool new toys in the tooling and a big part of that is the Camel Editor (i.e. the "Fuse Tooling Routes Editor"). The Fuse Transformation tooling builds on that and offers:
-
the Fuse Transformation Editor, which offers visual editing of a Dozer configuration file
-
the New Fuse Transformation wizard, which creates a new Transformation file and integrates it as an endpoint in a Camel configuration
-
and the New Fuse Transformation Test wizard, which creates the outline for a new JUnit test you can run to test your transformation
Though we’re in Tech Preview for now, we have good collection of functionality already and we’ll walk through some of that.
Where Can We Get These Toys?
The new tooling appears in the JBoss Tools Integration Stack "Early Access" site, so be sure to keep up with that effort. (You can see Paul’s latest post here: "JBoss Tools Integration Stack - Luna integration tooling for BRMS/BPMS, Data Virt, SOA 5.x + Early Access Fuse and SwitchYard."
Keep up to date with JBoss Tools Integration Stack to ensure you have the latest version of the Transformation tooling.
Let’s Start With a Use Case - XML to JSON
I’m going to cheat a little and start with the "Starter" project that we have created for the Transformation project. It includes some sample data to demonstrate transforming from XML to JSON. It includes a sample Camel configuration as well (in either Spring or Blueprint form) that provides a route that takes a file and routes it to another. In this case, we’re going from a sales order in XML format (abc-order.xml) to a sales order in JSON format (xyz-order-schema.json). This is a common integration case where you have to migrate one format to another.
But Wait! Didn’t You Say Dozer Is Strictly Java-to-Java?
Why yes, I did! But I also said that we have ways to create Java models from other formats. And in this first wave of Transformation functionality we offer built-in conversion from XML (XML schemas or instance documents) and JSON (JSON schemas or instance documents) to help get you that far. plus some other, more open-ended capabilities we’ll talk about down the line, we will walk through each step of getting you from your sample data to a fully testable solution.
So let’s get started…
Launching the Wizard
There are three main ways to launch the New Transformation Wizard in Eclipse…
-
From the top-level menu in the Eclipse workbench, use File→New→Other… (or Ctrl+N), then look for Fuse Tooling→Fuse Transformation
-
Right-click on a project in the Project Explorer, select New→Other… then look for Fuse Tooling→Fuse Transformation
-
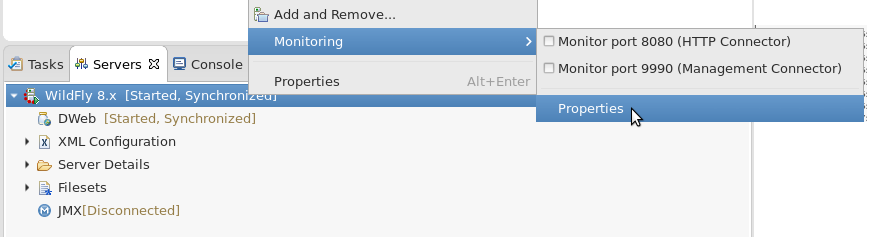
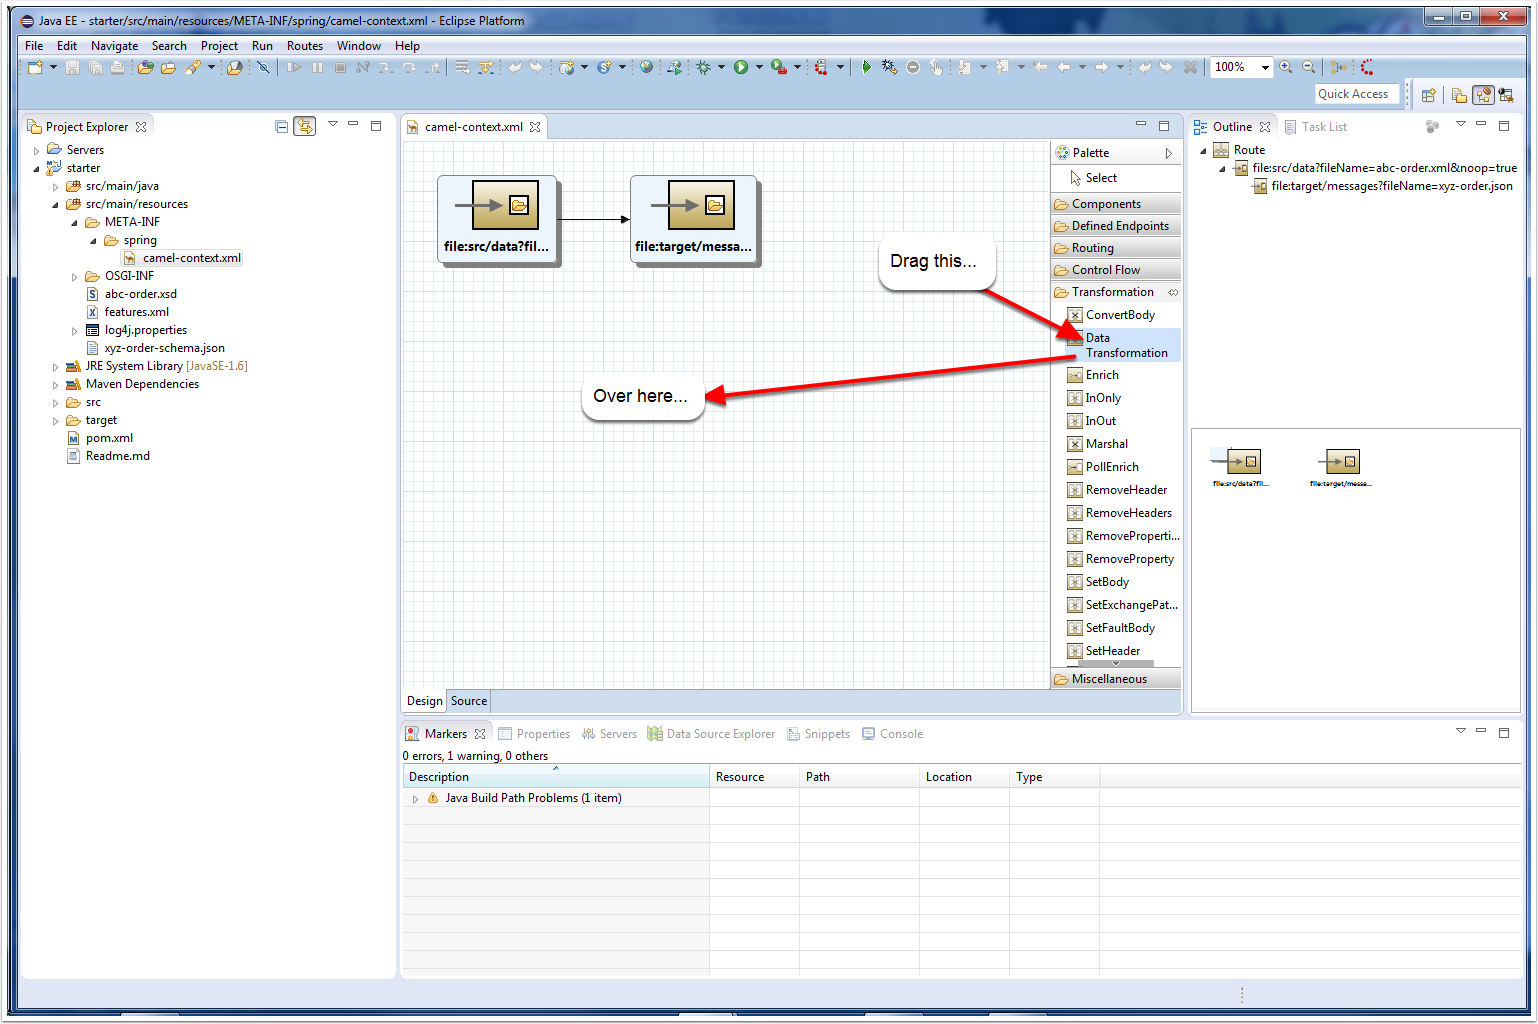
Open a Camel file (Spring or Blueprint) and drag the Transformation→Data Transformation item from the palette onto the canvas (see below)
New Fuse Transformation Wizard, Start Page
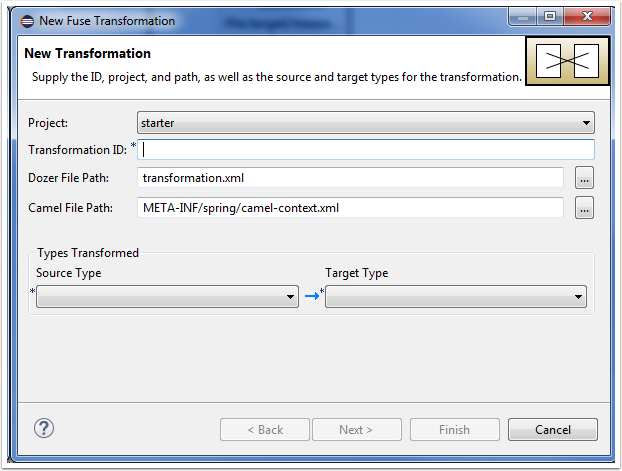
Once you’ve launched the New Fuse Transformation Wizard, you are presented with a wizard page that looks something like the following.
-
To start, depending on how you’ve launched the wizard, you may have to select the Project explicitly. The drop-down list is populated by a list of all projects that include Camel configurations (either Spring or Blueprint).
-
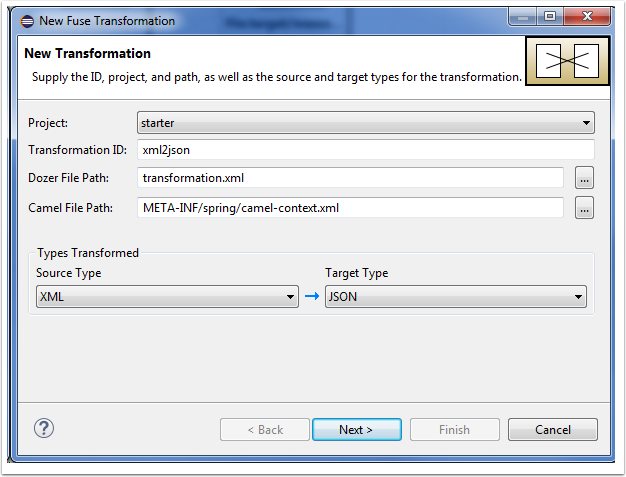
The Transformation ID becomes the explicit name of the Dozer endpoint that gets created in the Camel route. We then can reference that endpoint in the route itself. Since we’re transforming an XML file into a JSON file, we’ll call ours "xml2json".
-
The Dozer File Path calls out the location and name of the Dozer configuration file. It is pre-populated with the name "transformation.xml" and will place the file in the src/main/resource folder of your project, but you can name it whatever you’d like and provide a project-relative path so long as the path can be found in the project classpath. We’ll leave it at the default for now.
-
The Camel File Path points to the Camel configuration file you are adding this transformation to. In the case below, we have selected the Spring Camel configuration in the starter project.
New Fuse Transformation Wizard, Selecting Types to Transform
Currently with the wizard we have the ability to transform to and from one of four different types:
-
Java (Existing Java model)
-
XML (XML Schema or Instance Document)
-
JSON (JSON Schema or Instance Document)
-
Other (Special case we’ll cover in another post)
Today we’re focused on converting from XML to JSON, so we’ll select those two types and click Next.
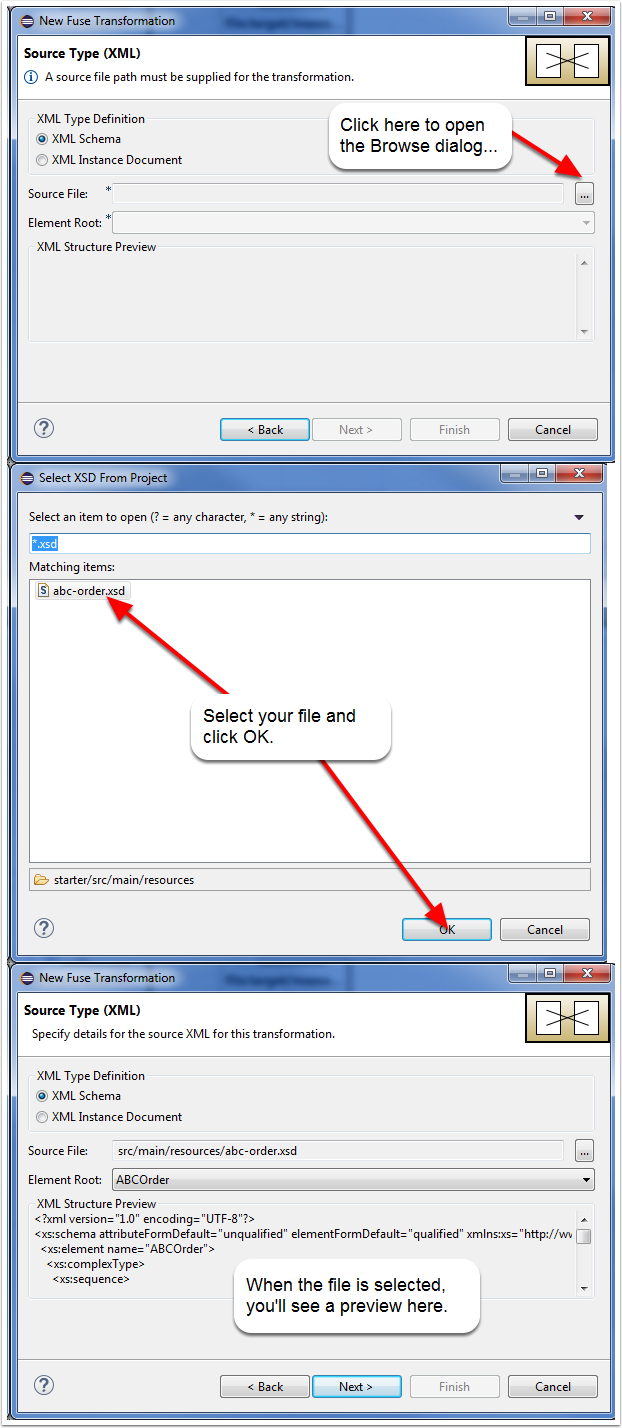
New Fuse Transformation Wizard, Source XML Details
Since we selected XML as the Source Type on the Start page, we’ll see the "Source Type (XML)" page appear next. If we had selected another type, we’d see that page here.
In this case, we have an XML Schema document (abc-order.xml) that we want to transform from. So we’ll click on the Source File field’s "…" button to browse for our file, select abc-order.xml, and click Next to continue. If you have a particularly complex schema, you may need to select from the root elements you wish to key on for the transformation.
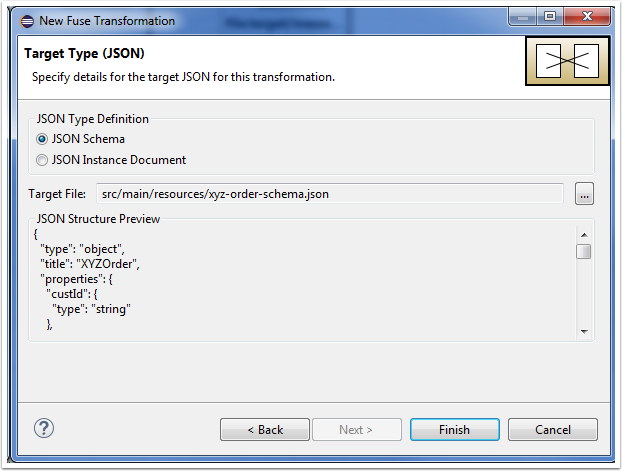
New Fuse Transformation Wizard, Target JSON Details
Since we selected JSON as the Target Type on the Start page, we’ll see the "Target Type (JSON)" page appear next. If we had selected another type, we’d see that page here.
In this case, we have an JSON Schema document (xyz-order-schema.json) that we want to transform to. So we’ll click on the Target File field’s "…" button to browse for our file, select xyz-order-schema.json, and click Finish to continue.
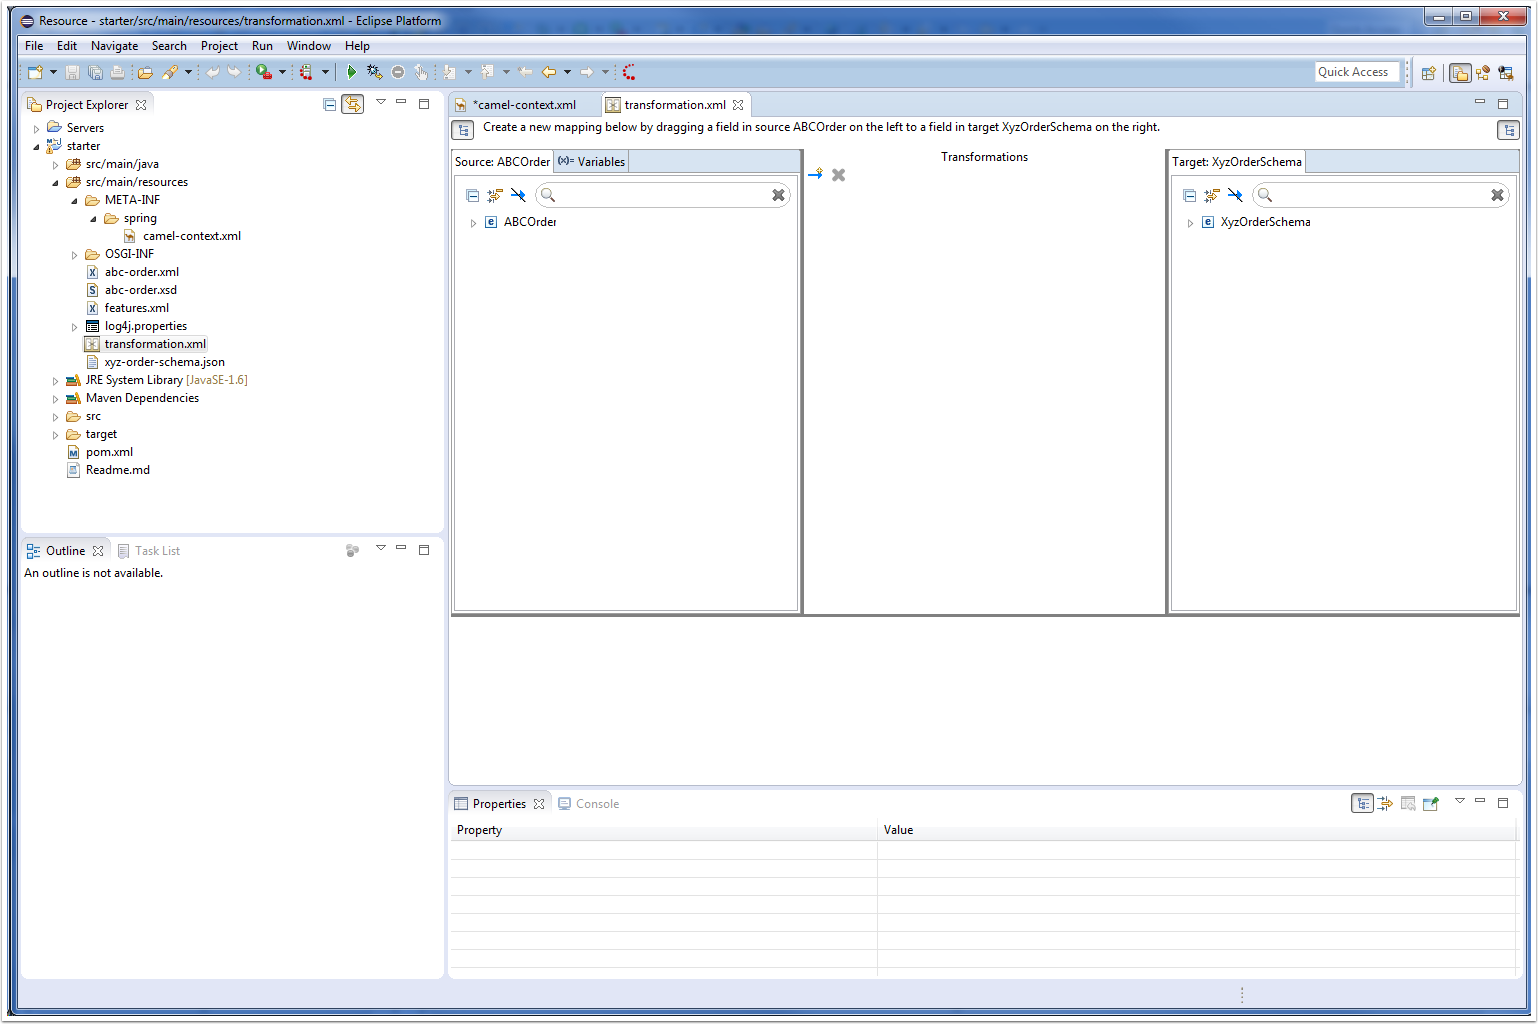
Finishing Up…
As soon as the wizard is done, you’ll notice two things.
-
The Fuse Transformation Editor opens so you can edit your new Dozer configuration file.
-
The Camel Editor has been updated with the new Transformation endpoint you just created. (Notice the "dirty" flag on the "camel-context.xml" tab.)
For now, we’ll close our new Transformation and go back to the Camel route to finish hooking up the new endpoint.
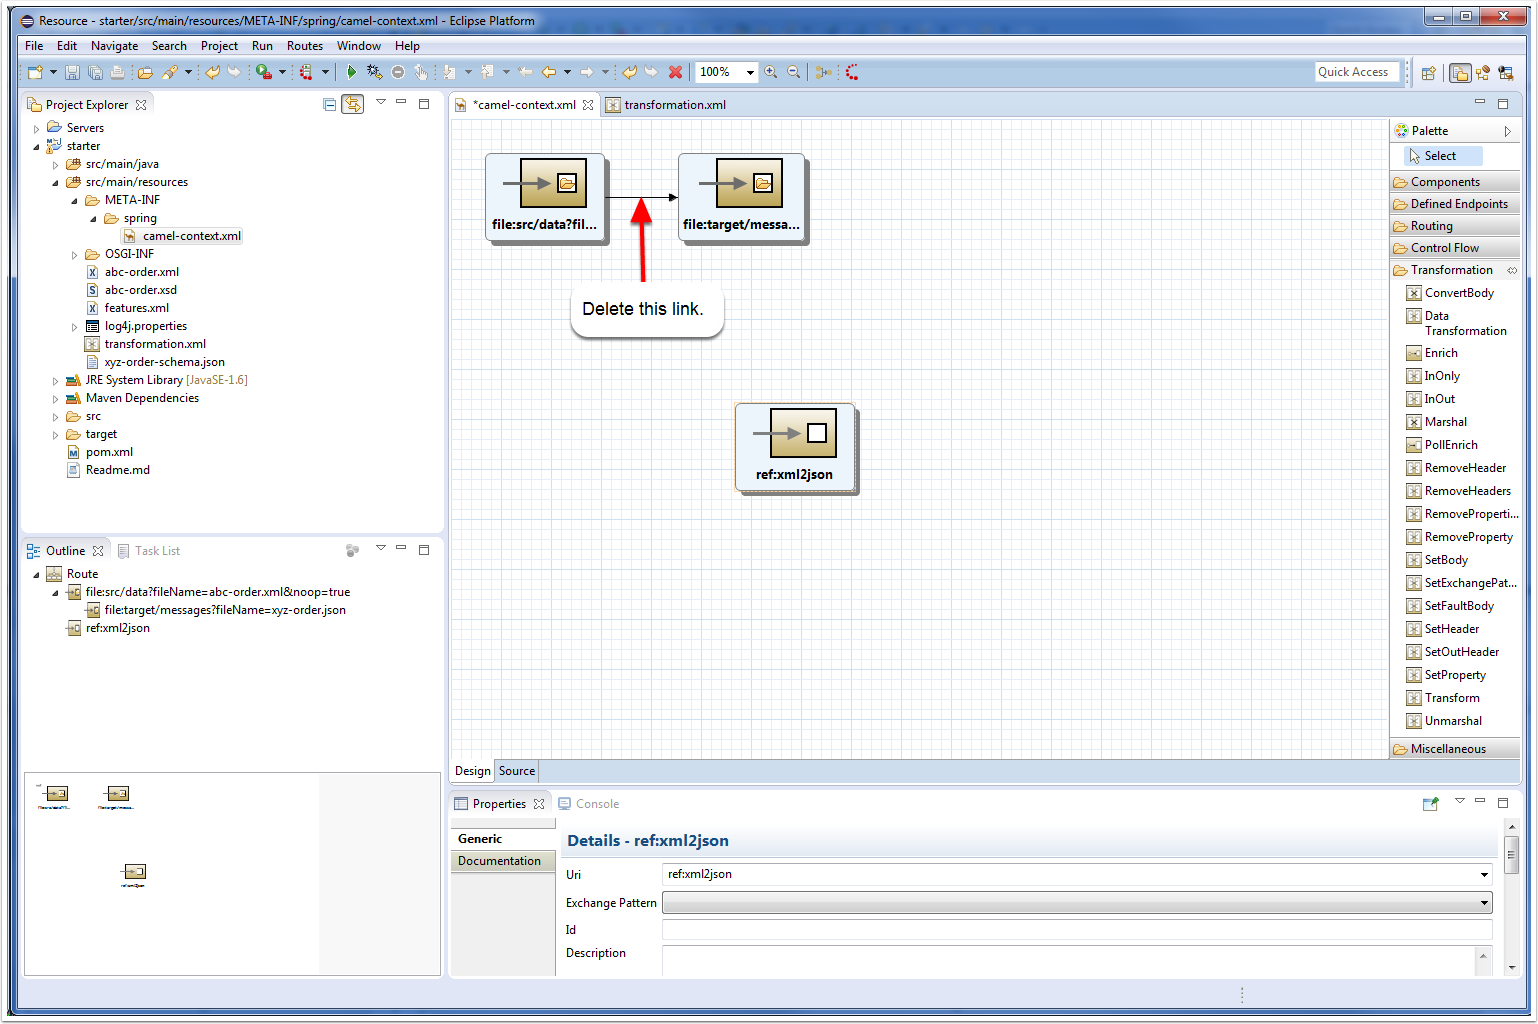
Going back to the Camel editor
When we select the Camel editor again, we notice that a new endpoint reference has been added to the canvas. We need to now hook that into our route so it happens between our source and target steps of this simple configuration.
The first thing we need to do is delete the existing link between the "src" and "target" elements of the route. You can click on it and hit the Delete key on your keyboard or right-click on the arrow and select "Remove." When it asks if you want to remove the element, click Yes.
Wiring up our New Endpoint
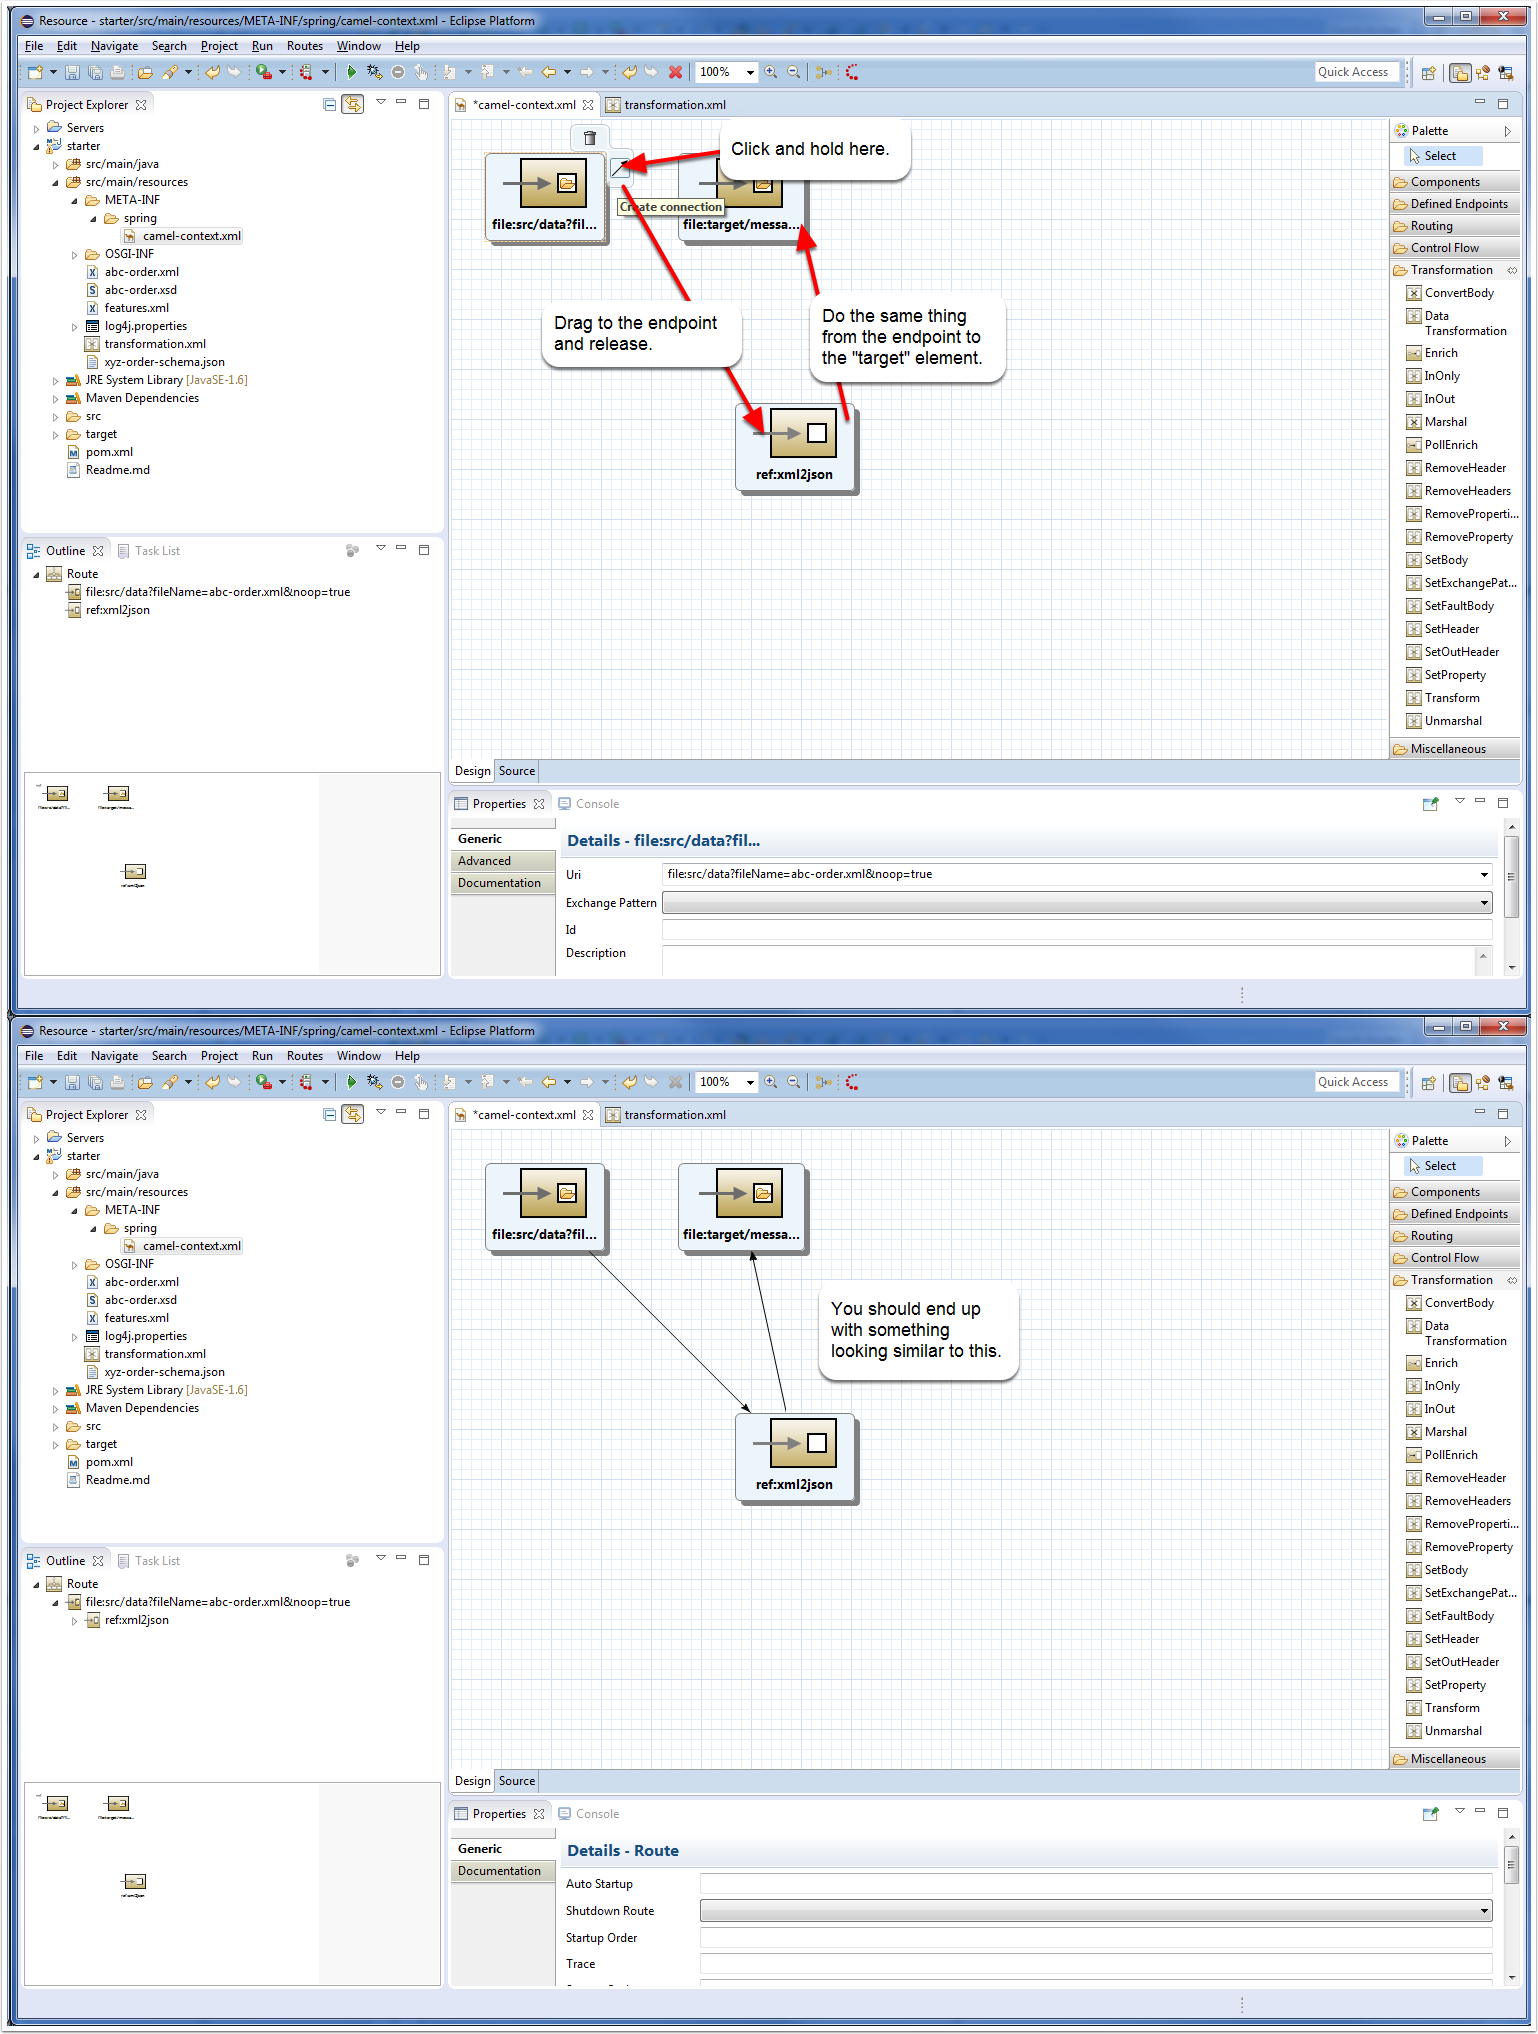
Now we can wire up the endpoint.
-
If you hover the mouse over the "src" file element, you’ll see a toolbar pop up. Click and drag the Arrow to our new endpoint.
-
Do the same thing from the endpoint to the "target" element.
-
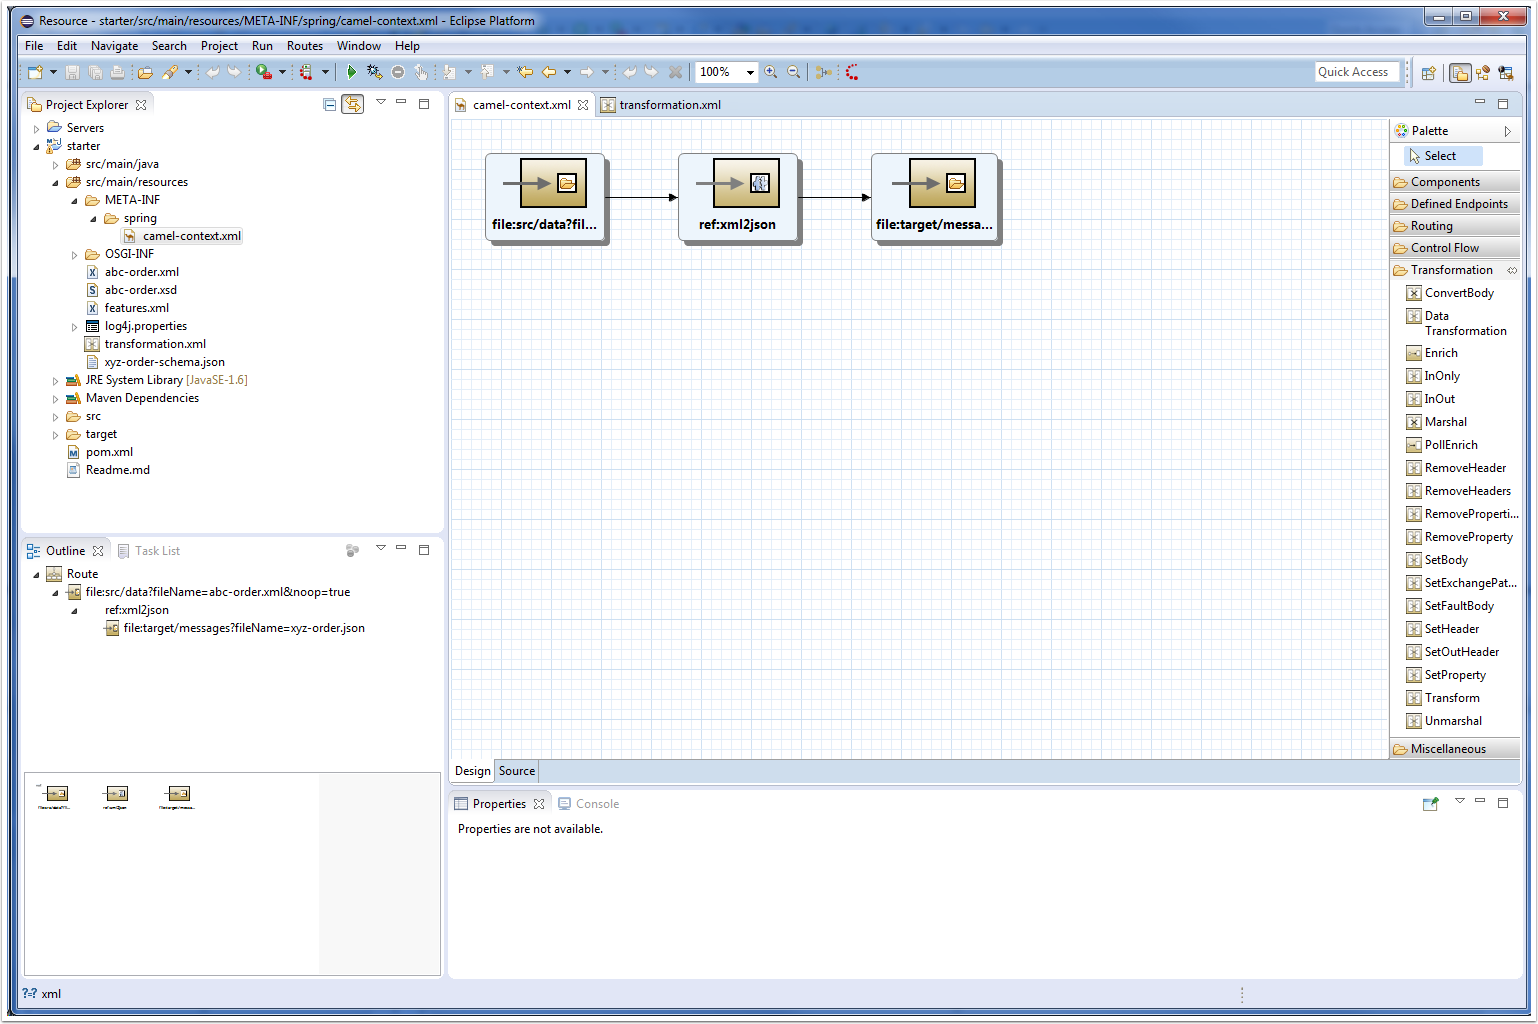
Next, save the Camel editor and it will refresh the view to clean up your route a little.