JBoss Tools and Eclipse Linux Tools team members from Red Hat are currently busy working on Docker tooling for Eclipse and even though the code is not public yet (more details on that at the end of this blog entry), I thought it would be interesting to share our progress on the project.
| Since this blog was published binary builds are now at http://download.eclipse.org/linuxtools/updates-docker-nightly/ and code is available from git.eclipse.org and mirrored on github. |
The Docker tooling is aimed at providing at minimum the same basic level features as the command-line interface, but also provide some advantages by having access to a full fledged UI.
Docker Explorer
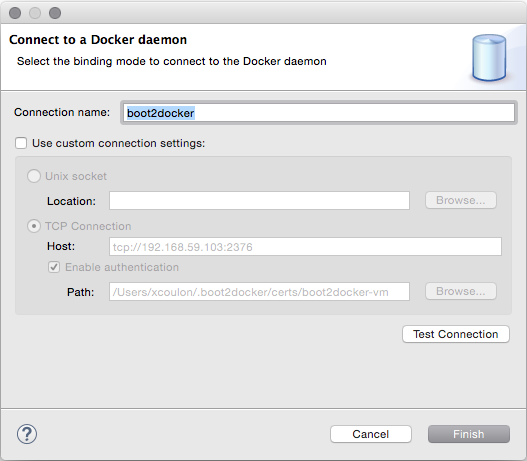
The Docker Explorer provides a wizard to establish a new connection to a Docker daemon. This wizard can detect default settings if the user’s machine runs Docker natively or in a VM using Boot2Docker. Both Unix sockets on Linux machines and the REST API on other OSes are detected and supported. The wizard also allows remote connections using custom settings.
The Docker Explorer itself is a tree view that handles multiple connections and provides users with quick overview of the existing images and containers.
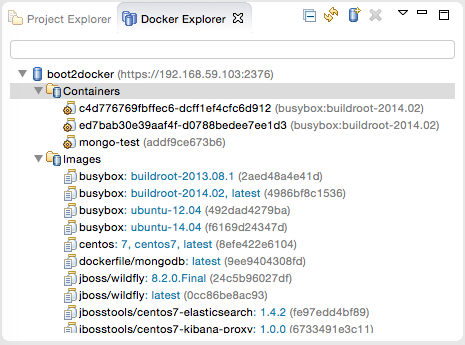
Built-in filters can show/hide intermediate and 'dangling' images as well as stopped containers.
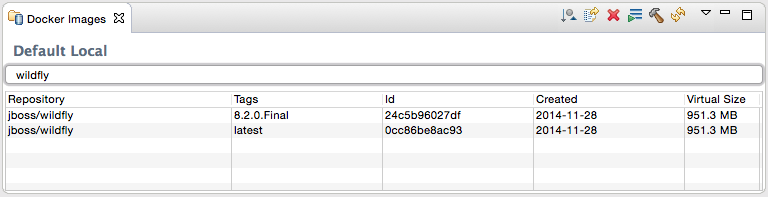
Managing Docker Images
The Docker Images view lists all images in the Docker host selected in the Docker Explorer view. This view allows user to manage images, including:
-
Pulling images from the Docker Hub Registry (other registries will be supported as well)
-
Uploading images to the Docker Hub Registry
-
Building images from a Dockerfile
-
Creating a container from an image
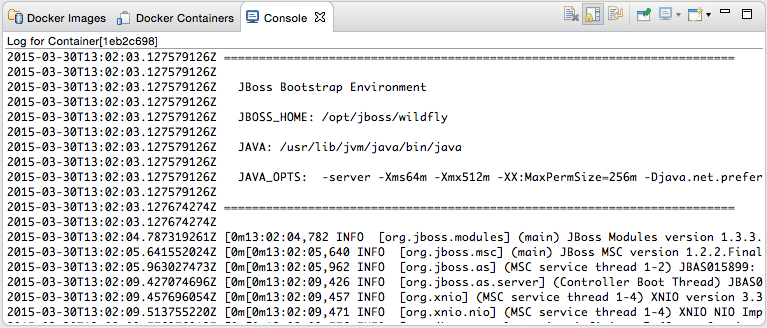
A wizard lets the user input all the arguments to create a new container from an image. When the container is started, all the logs can be streamed into the Eclipse Console:
Managing Docker Containers
The Docker Containers view lets the user manage her containers. The view toolbar provides commands to start, stop, pause, unpause, display the logs and kill containers.
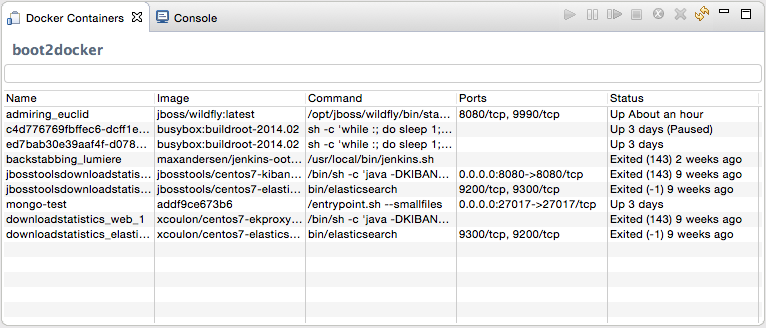
This view also provides a filter to show/hide stopped containers. Users can also attach an Eclipse console to a running Docker container to follow the logs and use the STDIN to interact with it.
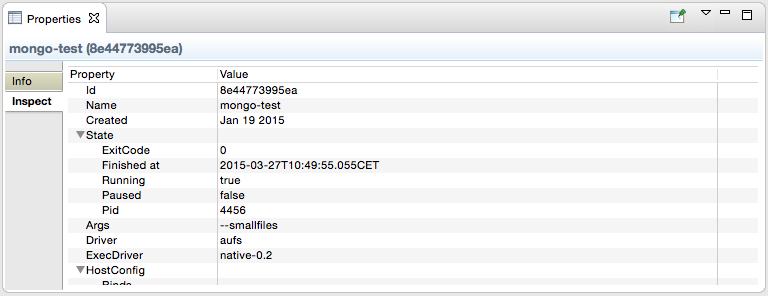
Info and Inspect on Images and Containers
We also integrate with the Eclipse Properties view to provide users with info and 'inspect' data about a selected container or image.
Where is the code ?
Roland Grunberg and Jeff Johnston from Red Hat started this project and are currently in the process of getting the code accepted to Eclipse.org as part of the Linux Tools project (even if the tooling also runs on other platforms), which explains why the code has not been made public yet.
Taking about code, we rely on the open source Docker client developed by Spotify to handle the low-level communication with the Docker daemons and I should thank the Spotify developers who maintain this library. They’ve been very kind to quickly review and merge the pull requests that we’ve submitted and it’s been a pleasure to contribute to their project. Open source collaboration FTW :-)
What’s next ?
There is still some work and the screenshots showed above may still evolve as we add more features, but we hope that this blog entry will give you a taste of what’s coming soon in Eclipse with regards to Docker tooling.
While the code will be hosted in Linux Tools project at Eclipse.org, we intend to also ship it as part of JBoss Developer Studio 9 and JBoss Tools 4.3 later this year.
We also created a JIRA component to track this work-in-progress in the scope of JBoss Tools, including some issues with mockups.
Beyond this basic Docker tooling we are looking at integrating launching servers and even native CDT builds on docker containers, but this will be the subject of future posts on this blog ;-)
As usual, feel free to provide us with feedback on our forum, on JIRA or on IRC. Questions, comments and suggestions are always welcome!
Stay tuned!
/Xavier
@xcoulon