
I’m happy to announce that from today JBoss Tools 4.3 Beta1 and Developer Studio 9 Beta1 is available for download.
Java 8 to run Eclipse; older runtimes OK for builds/deployment
To use this Beta, you must run Eclipse with Java 8.
You can still target development for old Java versions though. Yes, you can still target your Java 1.4 projects :)
We are doing this because certain components of Eclipse Mars now require Java 8 (especially Sapphire) and according to our usage stats, Java 8 will have gained majority this year.
But we have not made JBoss Tools dependent on Java 8 yet, since we want to get feedback from users on whether requiring Java 8 will be a problem.
Let us know on our forum, or contact Red Hat support if this will be a problem for you to use it.
Installation
JBoss Developer Studio comes with everything pre-bundled in its installer. Simply download it from our JBoss Products page and run it like this:
java -jar jboss-devstudio-<installername>.jar
JBoss Tools or Bring-Your-Own-Eclipse (BYOE) JBoss Developer Studio require a bit more:
This release requires at least Eclipse 4.5 (Mars) but we recommend using the Eclipse 4.5 JEE Bundle since then you get most of the dependencies preinstalled. In case that page it not available check main eclipse download for the Mars release.
Once you have installed Eclipse, you can either find us on the Eclipse Marketplace under "JBoss Tools (Mars)" or "JBoss Developer Studio (Mars)".
For JBoss Tools, you can also use our update site directly if you are up for it.
http://download.jboss.org/jbosstools/mars/development/updates
Note: Integration Stack tooling will become available from JBoss Central at a later date.
What is new ?
The full details of what is new is available on this page. Some highlights below.
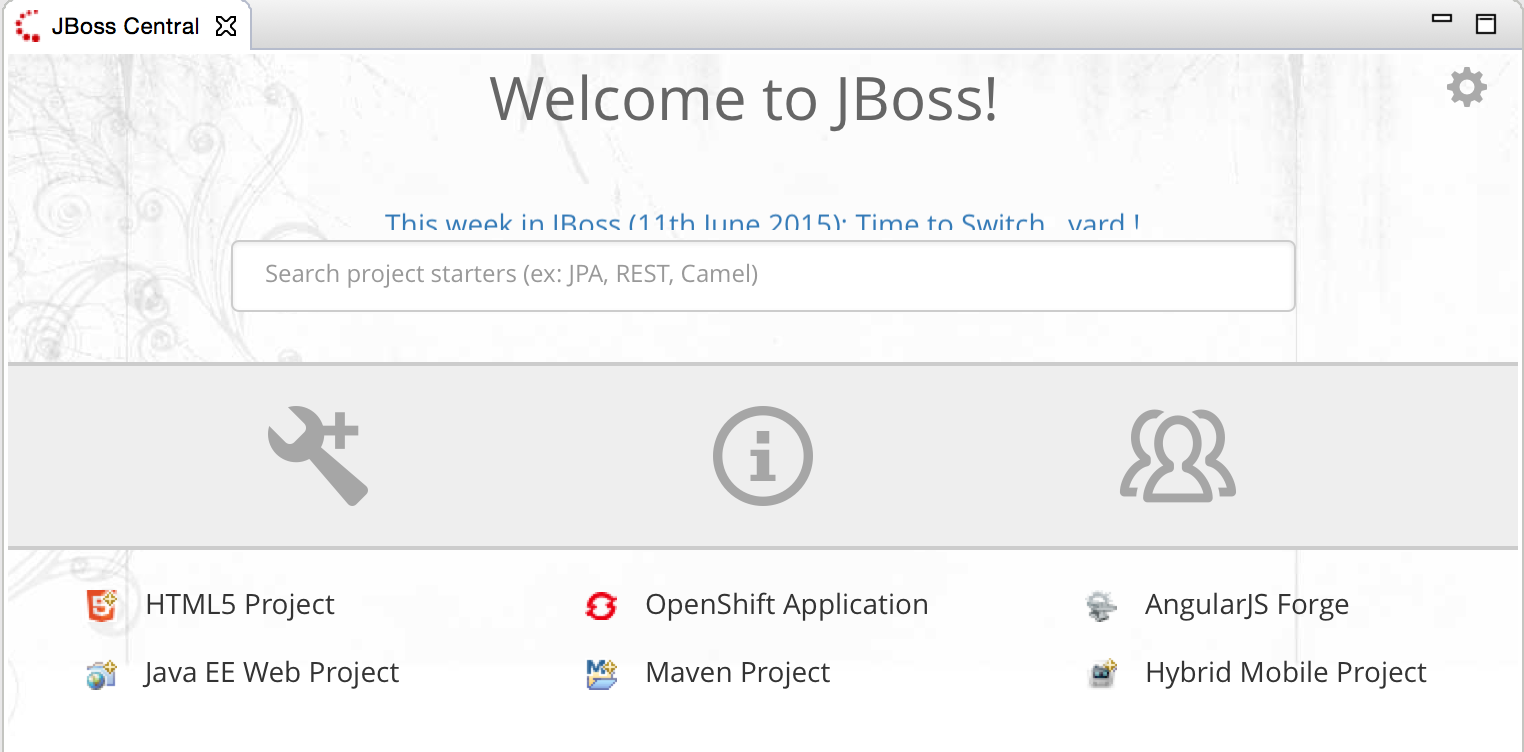
New Shiny Central
JBoss Central has now been updated to be faster to load, less overloaded and give access to any project example from developer.jboss.org.
Docker tooling
There is now tooling to connect to (multiple) Docker daemons which allows you to pull, build, start, stop, etc. Images and Containers.
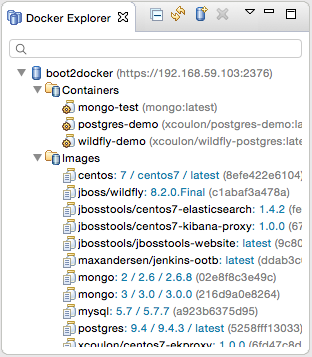
The Docker tooling is technically part of Eclipse Mars, but we wanted to make it easily available to all JBoss Tools users, so we included it into our updatesite. In future releases, we will add some specific JBoss Tools integrations for our server adapters and OpenShift - but for now, what is included are the vanilla Eclipse Mars Docker tools.
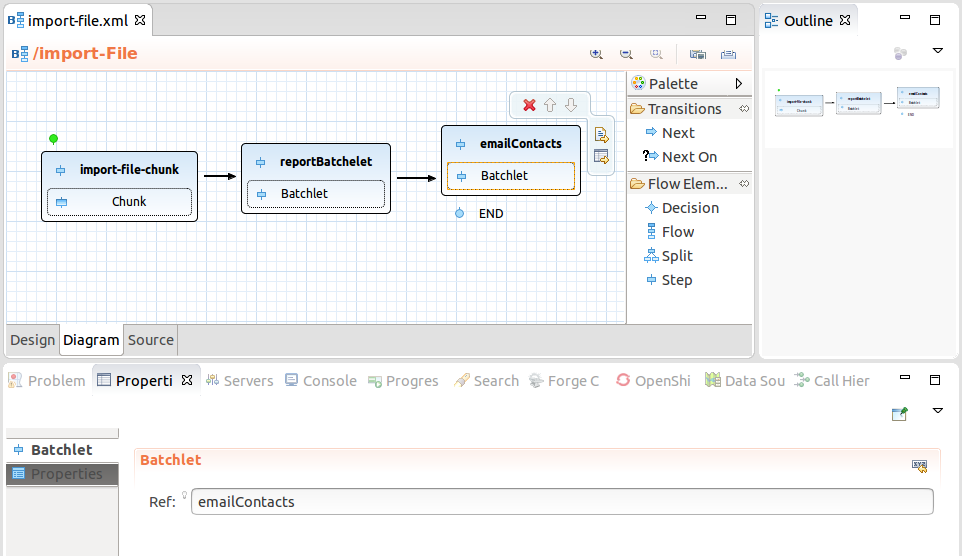
Visual Java EE 7 Batch
We’ve added a visual diagram editor for Java EE 7 Batch tooling. Allowing you to visualize and edit your batch flow:
Big thanks to Tomáš Milata who worked on this for his thesis and contributed the foundation for this functionality!
Below is a video of the highlights of the feature set:
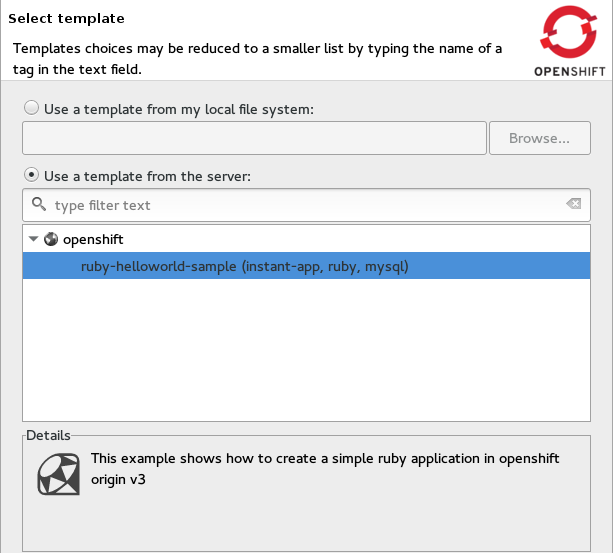
OpenShift 3
OpenShift 3 now works with OAuth logins as well as basic authentication and there is now support for creating applications from OpenShift/Kubernetes templates.
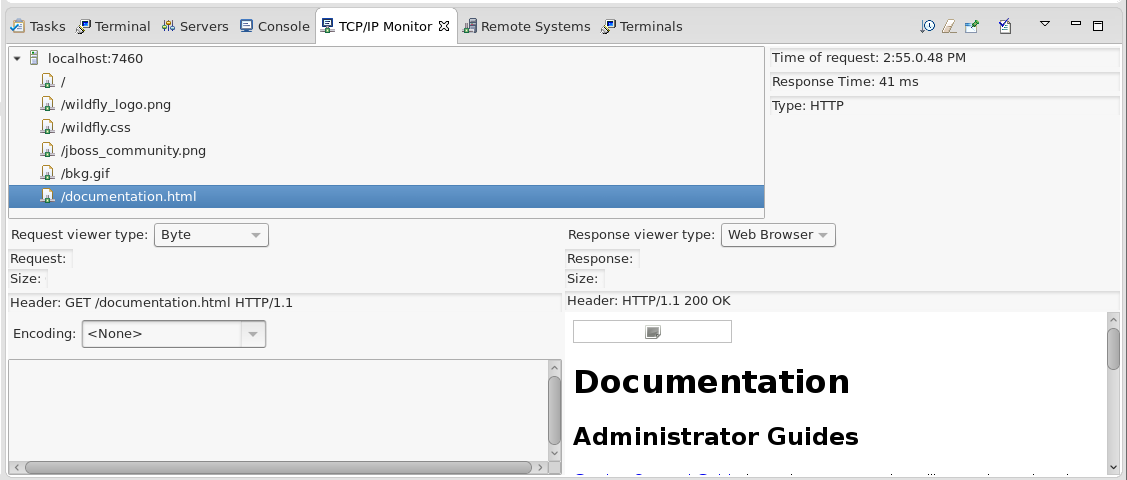
Port Monitoring
JBoss server adapters now support port monitoring, allowing you to trace and inspect requests made to a server.
Experimental LaunchBar
The Eclipse CDT project created a new feature called the LaunchBar, allowing to easily run launch configurations. We’ve added experimental support for WTP server adapters (like JBoss server adapters) making them as easy to run as a Java app. Details here.

Next steps
Let us know what you like/hate about the release and if you find issues, please open a ticket at our issue tracker.
Going from Beta1 to Beta2, we are focusing on reported issues and going for improving Docker, OpenShift, JavaScript and JavaEE related features.
Hope you enjoy it and remember…
Have fun!
Max Rydahl Andersen
@maxandersen

